Flat Infographics Presentation templates - Page 15
The flat graphic style is appealing, quite colorful and helps simplify your data in a visual manner. Adapt these infographics for your presentations and let the bright tones do the work!


It seems that you like this template!

Register for free and start downloading now
Even if we don't like it, there are bacteria everywhere (except in our presentations, because bacteria on the Internet can't resist). However, we have designed a set of infographics for you to talk about bacterial infections and make your content more visual and therefore clearer. Discover these infographic resources now!
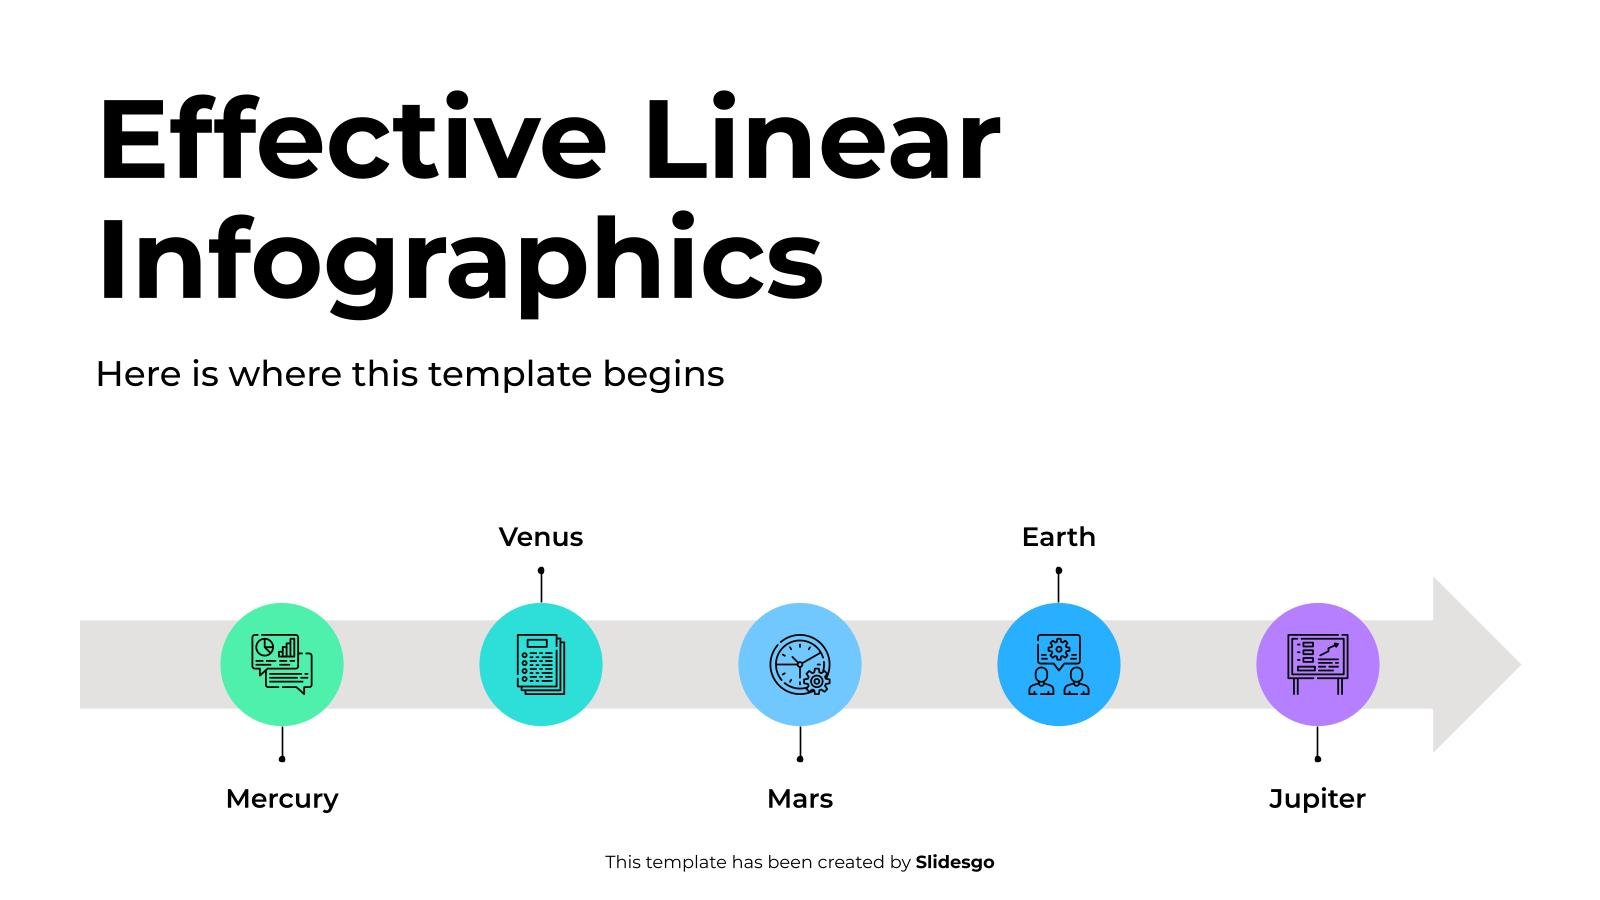
Download the Effective Linear Infographics presentation for PowerPoint or Google Slides. Conveying your business plan accurately and effectively is the cornerstone of any successful venture. This template allows you to pinpoint essential elements of your operation while your audience will appreciate the clear and concise presentation, eliminating any potential misunderstandings....

Are you a believer? Of what? There are so many religions and so many things to believe on, that one can even lose track of the options available. Faith is in reality more of a personal thing that is born from within and that can even change trough your life!...

Make your presentation about microbes visually interesting with these infographics! The illustrations on these slides make microbes look cute, and also keep them from being too bland. After all, a professional presentation should present accurate information, but visually appealing at the same time. So add a touch of visual excitement...

A business continuity framework is a logistical plan that describes how an organization should recover and restore its critical functions after an emergency or disruption. Designing them is fundamental to a company's risk management. Disseminate your company's business continuity plans to your entire team with these useful infographics we have...

Apples, oranges, bananas, pineapples, watermelons... The variety of fruit available in this world is huge! They're a healthy source of vitamins and other beneficial substances, and we're sure you know some recipes that you'd like to share with your audience. Download this set of infographics, customize them and surprise everyone!...

In most countries, women are paid less than men. The thing is: why hasn't this issue been fixed yet? Raise awareness about salary inequality between genders by adding these customizable infographics to your slideshows. We've included around 30 examples of compositions that you can use. Besides your usual pie charts...

How many schematic visual representations can you come up with? Yes! We’ve risen to the challenge and this is the result: A set of infographics about the nervous system that covers everything from representations of the brain to complete models of humans’ nerves. And yes again, they’re already labeled, so...

Download the A/B Testing Infographics template for PowerPoint or Google Slides to get the most out of infographics. Whether you want to organize your business budget in a table or schematically analyze your sales over the past year, this set of infographic resources will be of great help. Start using...

Business benchmarking is a process used to identify and measure key performance indicators of an organization against those of industry peers. It can help companies understand their operations in comparison to their counterparts, discover areas for improvement and set achievable goals. But how to explain all that complex data in...

If you need some cute infographics for your presentation, we have these soft ones right here! If it’s to add them to the same design template or for another purpose, this Korean notebook inspired infographics will make you fall in love! They are really helpful if you need to present...
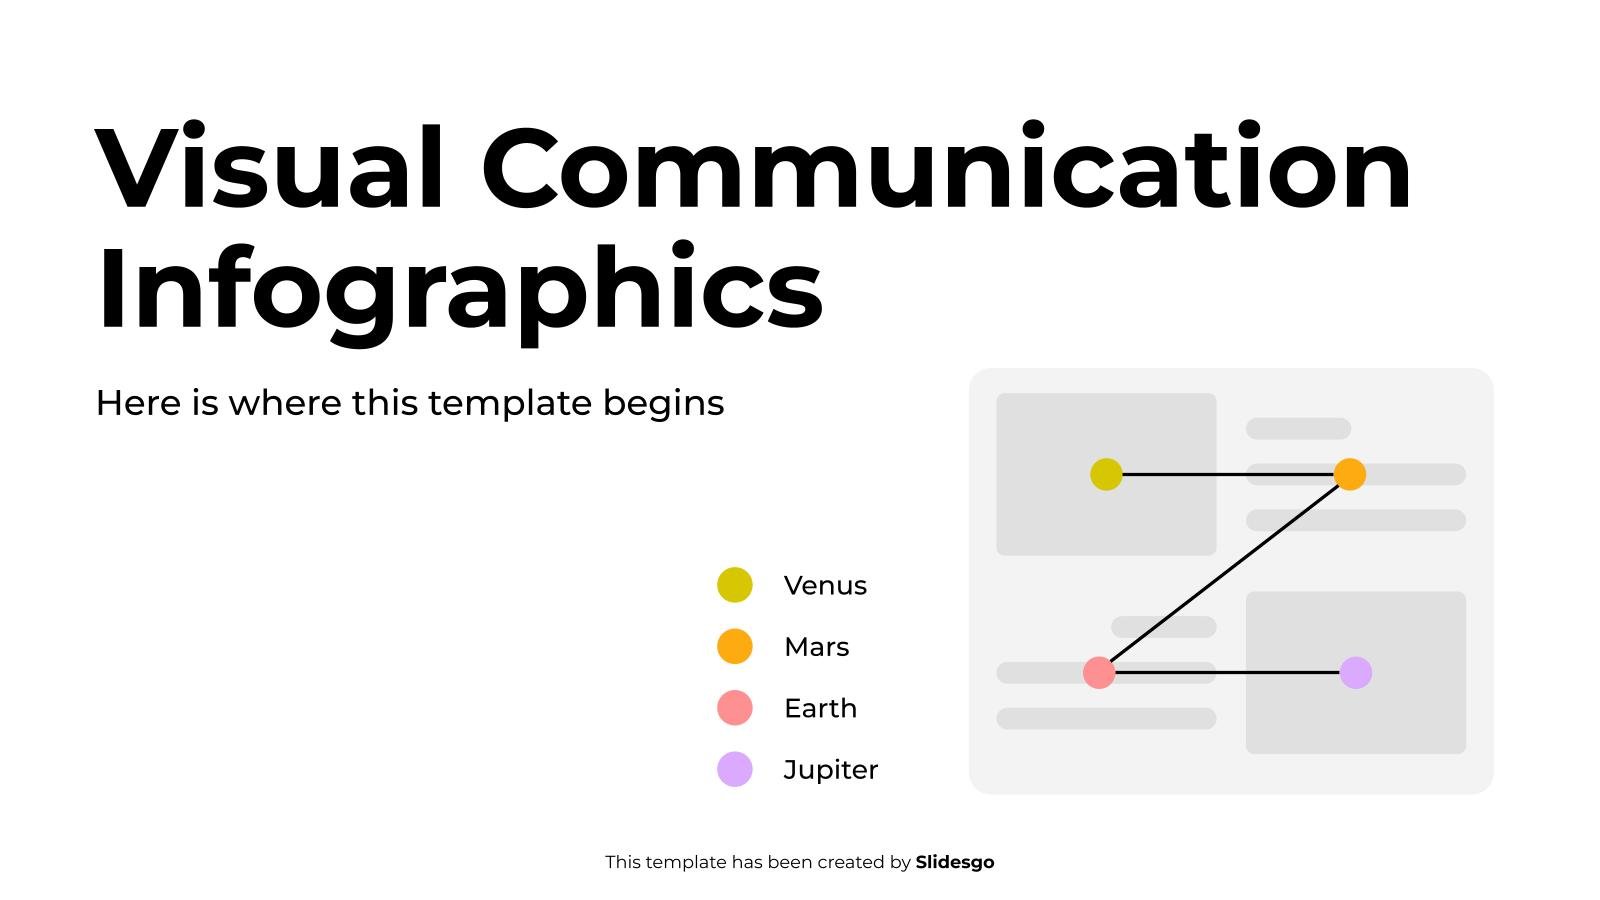
Download the Visual Communication Infographics template for PowerPoint or Google Slides to get the most out of infographics. Whether you want to organize your business budget in a table or schematically analyze your sales over the past year, this set of infographic resources will be of great help. Start using...

World Milk Day is a celebration of the liquid gold that keeps us healthy and strong! Every year, people all over the world come together to honor the amazing benefits of milk and dairy products. Celebrate this special day by presenting it with a fun presentation for friends and family...
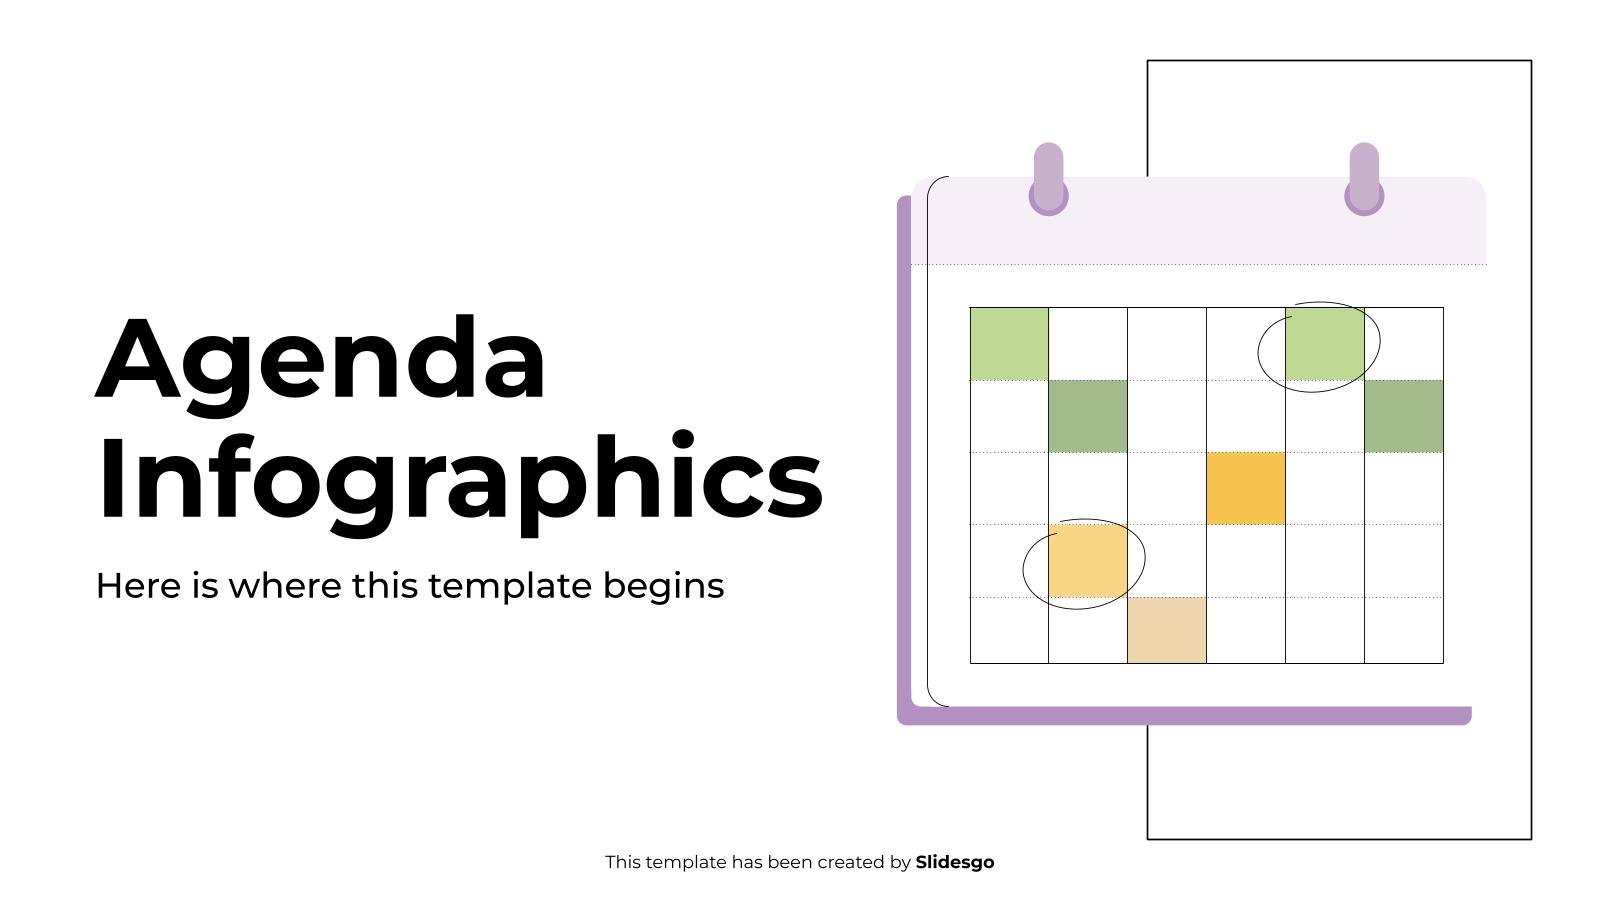
Download the Agenda Infographics template for PowerPoint or Google Slides to get the most out of infographics. Whether you want to organize your business budget in a table or schematically analyze your sales over the past year, this set of infographic resources will be of great help. Start using infographics...
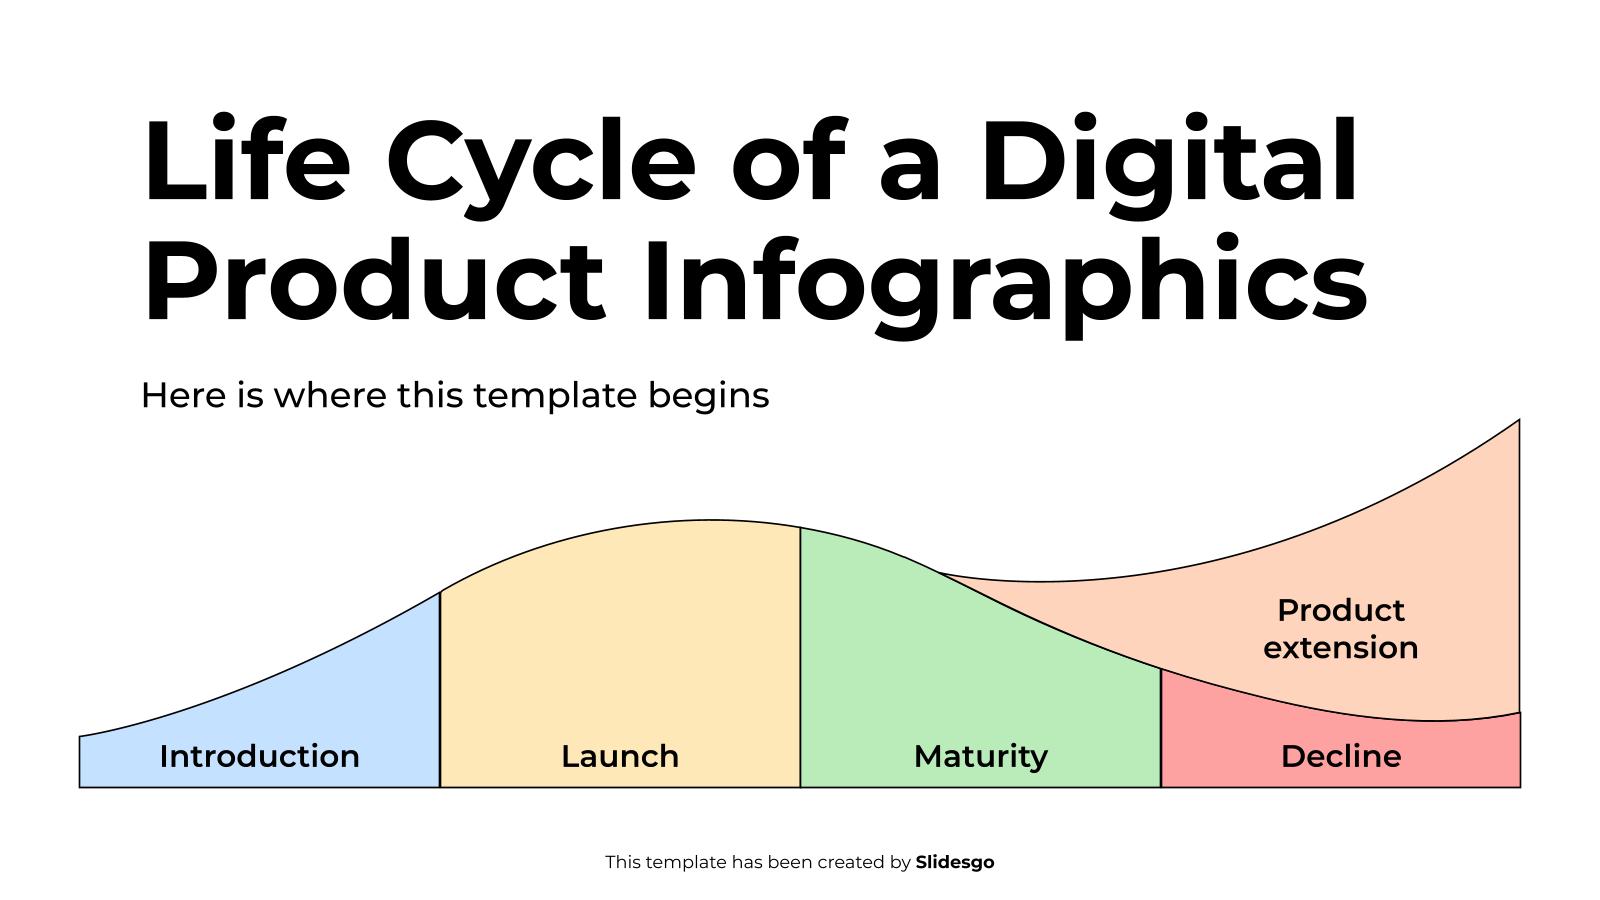
Download the Life Cycle of a Digital Product Infographics presentation for PowerPoint or Google Slides. Conveying your business plan accurately and effectively is the cornerstone of any successful venture. This template allows you to pinpoint essential elements of your operation while your audience will appreciate the clear and concise presentation,...

Have you ever struggled to share a complex idea or process? Diagram infographics will make sure that doesn't happen again. These visually stunning and creative representations of information can help you break down even the most complicated concepts. Even better, they are editable and customizable to your needs, whether you're...

Imagine this: a swirling vortex of information that leads you straight down a path to success. That's the power of a great funnel infographic. With a little bit of creativity, these editable visual aids can guide potential customers through the twists and turns of the decision-making process with ease. And...

Transform your data into a visual masterpiece with the power of chart infographics! Forget about dull spreadsheets and create something truly unique and compelling. With templates like this one, the sky's the limit when it comes to creativity and customization. And the best part? You can adapt them to your...