Dashboard Infographics Presentation templates - Page 2
When keeping track of multiple metrics at the same time, you need as much clarity as possible. Many vehicles and pieces of machinery have a dashboard, displaying information that can be monitored at a glance. You can do the same when giving business or marketing presentations, because Slidesgo has a good assortment of dashboard infographics. All of them are easily editable!


It seems that you like this template!

Register for free and start downloading now
Download the Monthly KPIs Overview Infographics template for PowerPoint or Google Slides to get the most out of infographics. Whether you want to organize your business budget in a table or schematically analyze your sales over the past year, this set of infographic resources will be of great help. Start...

Present a SEO audit for a web page with these illustrative infographics focused on search engine optimisation. They will help you represent all the data that you have been collecting in a visual way and will give a clear image of whether your page is positioning good or not. They...

There’s always a visual aid that helps you explain large amounts of information in a faster way: infographics. These graphs, maps and charts have been designed in a linear style (meaning they have no fill), and are intended for representing KPIs, or key performance indicators. If you need to give...
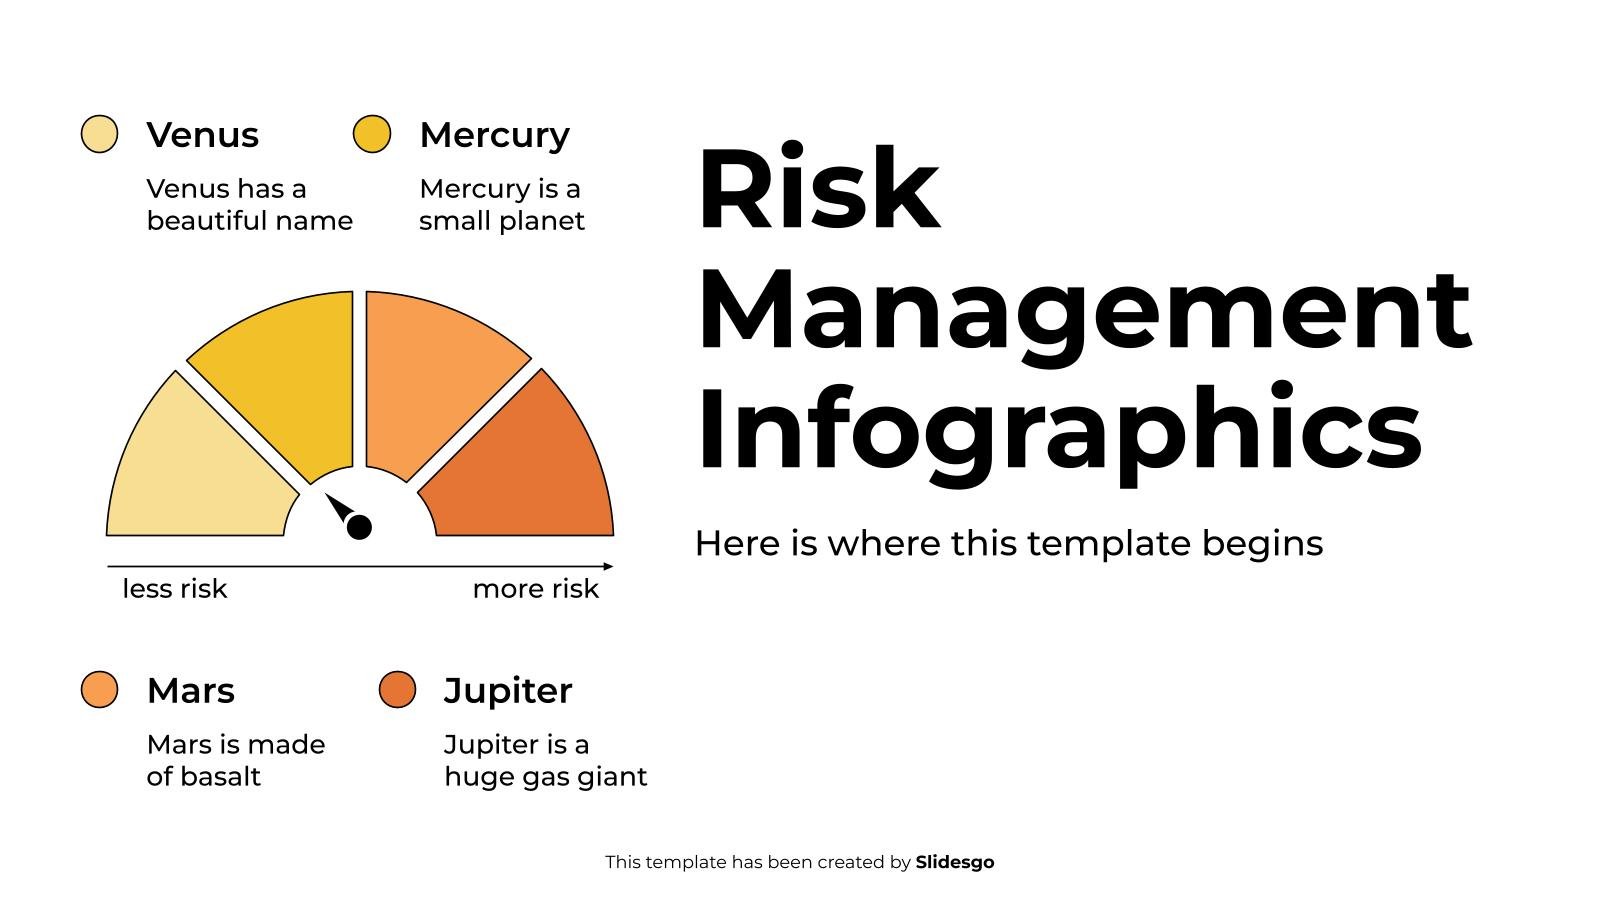
Download the Risk Management Infographics template for PowerPoint or Google Slides to get the most out of infographics. Whether you want to organize your business budget in a table or schematically analyze your sales over the past year, this set of infographic resources will be of great help. Start using...
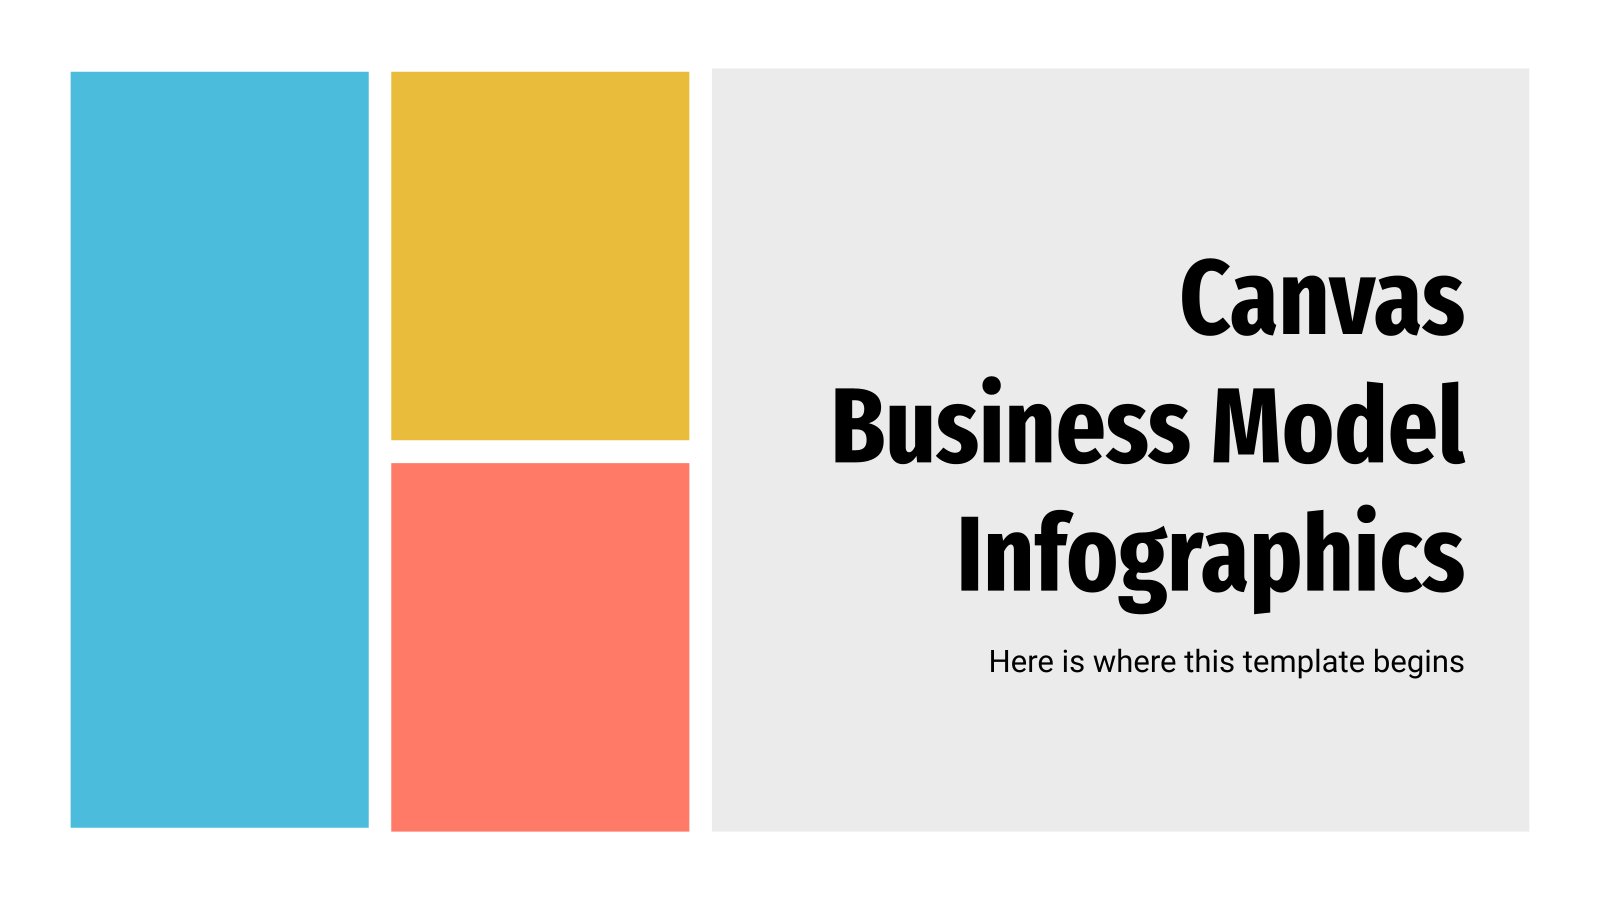
The Canvas Business Model was created by Swiss entrepreneur and author Alexander Osterwalder. It is a widely used template for developing new business models. If you are also creating yours, take a look at this infographic template inspired by this strategic management model that will help you put your ideas...

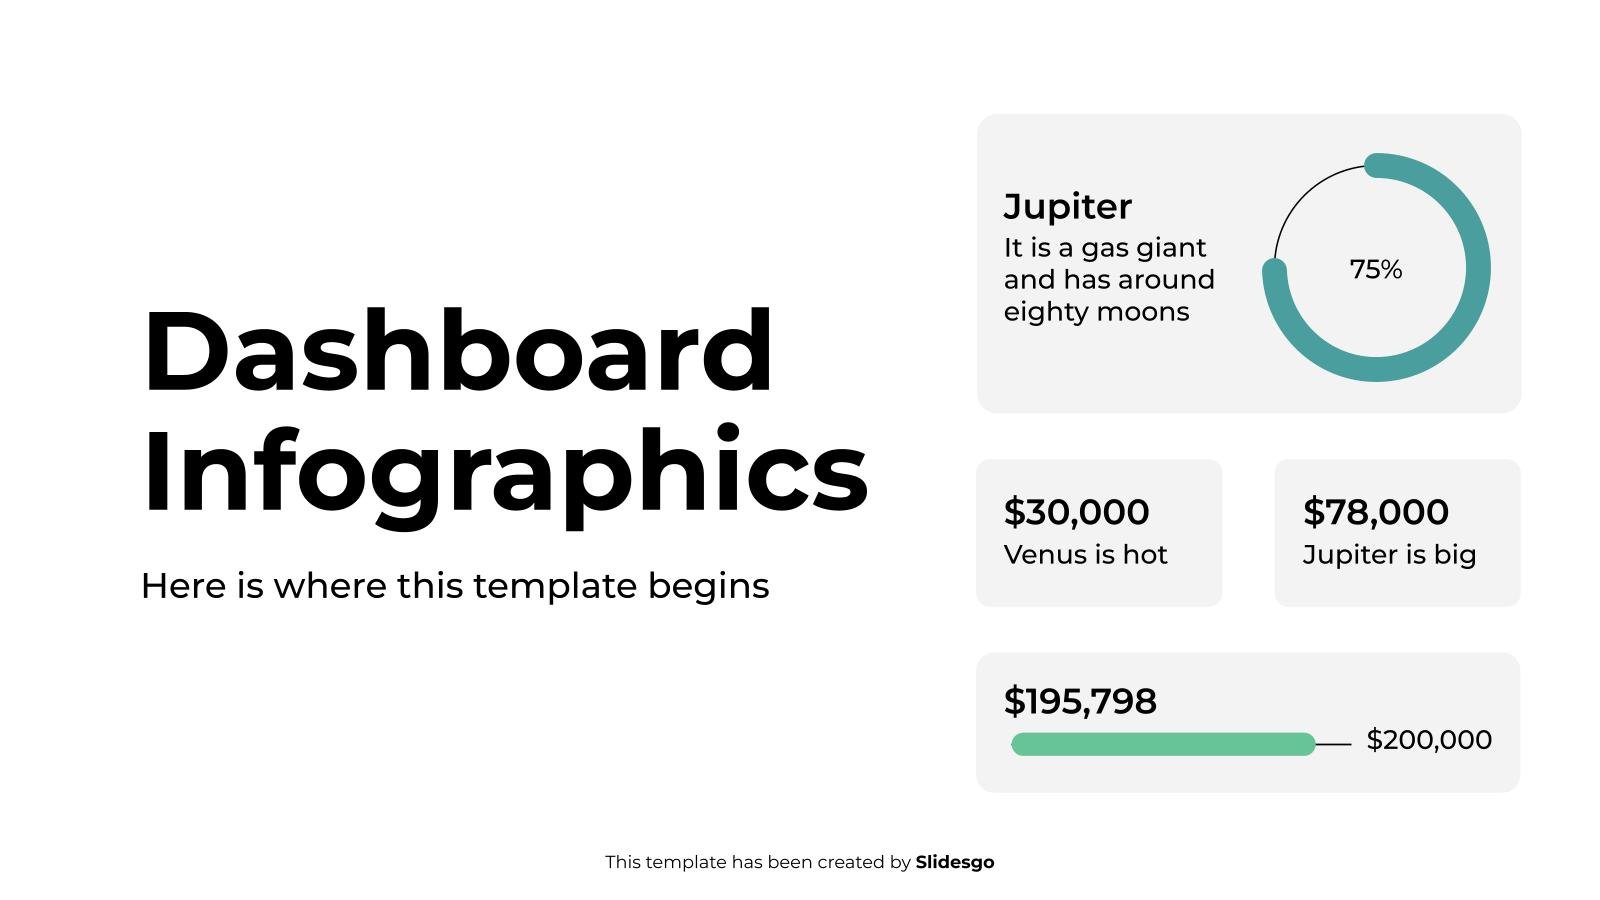
You may find keeping track of multiple metrics at the same time a bit difficult, especially if you need to have everything at the same place and ready to be seen at a glance. That is the purpose of the aptly named dashboard infographics. Have a look at this single...

Download the "Aesthetic Infographics" template for PowerPoint or Google Slides and discover the power of infographics. An infographic resource gives you the ability to showcase your content in a more visual way, which will make it easier for your audience to understand your topic. Slidesgo infographics like this set here...

Download the Dashboard Infographics template for PowerPoint or Google Slides and discover the power of infographics. An infographic resource gives you the ability to showcase your content in a more visual way, which will make it easier for your audience to understand your topic. Slidesgo infographics like this set here...

Become the productive person you always wanted to be with this set of planner infographics! Their versatile design allows you to plan days, weeks and even months in advance, and since they’re really easy to use you can paste them in your presentations, print them or use them as wallpapers...

Download the Dashboard Infographics template for PowerPoint or Google Slides and discover the power of infographics. An infographic resource gives you the ability to showcase your content in a more visual way, which will make it easier for your audience to understand your topic. Slidesgo infographics like this set here...

Download the Business Calendar Infographics template for PowerPoint or Google Slides to get the most out of infographics. Whether you want to organize your business budget in a table or schematically analyze your sales over the past year, this set of infographic resources will be of great help. Start using...
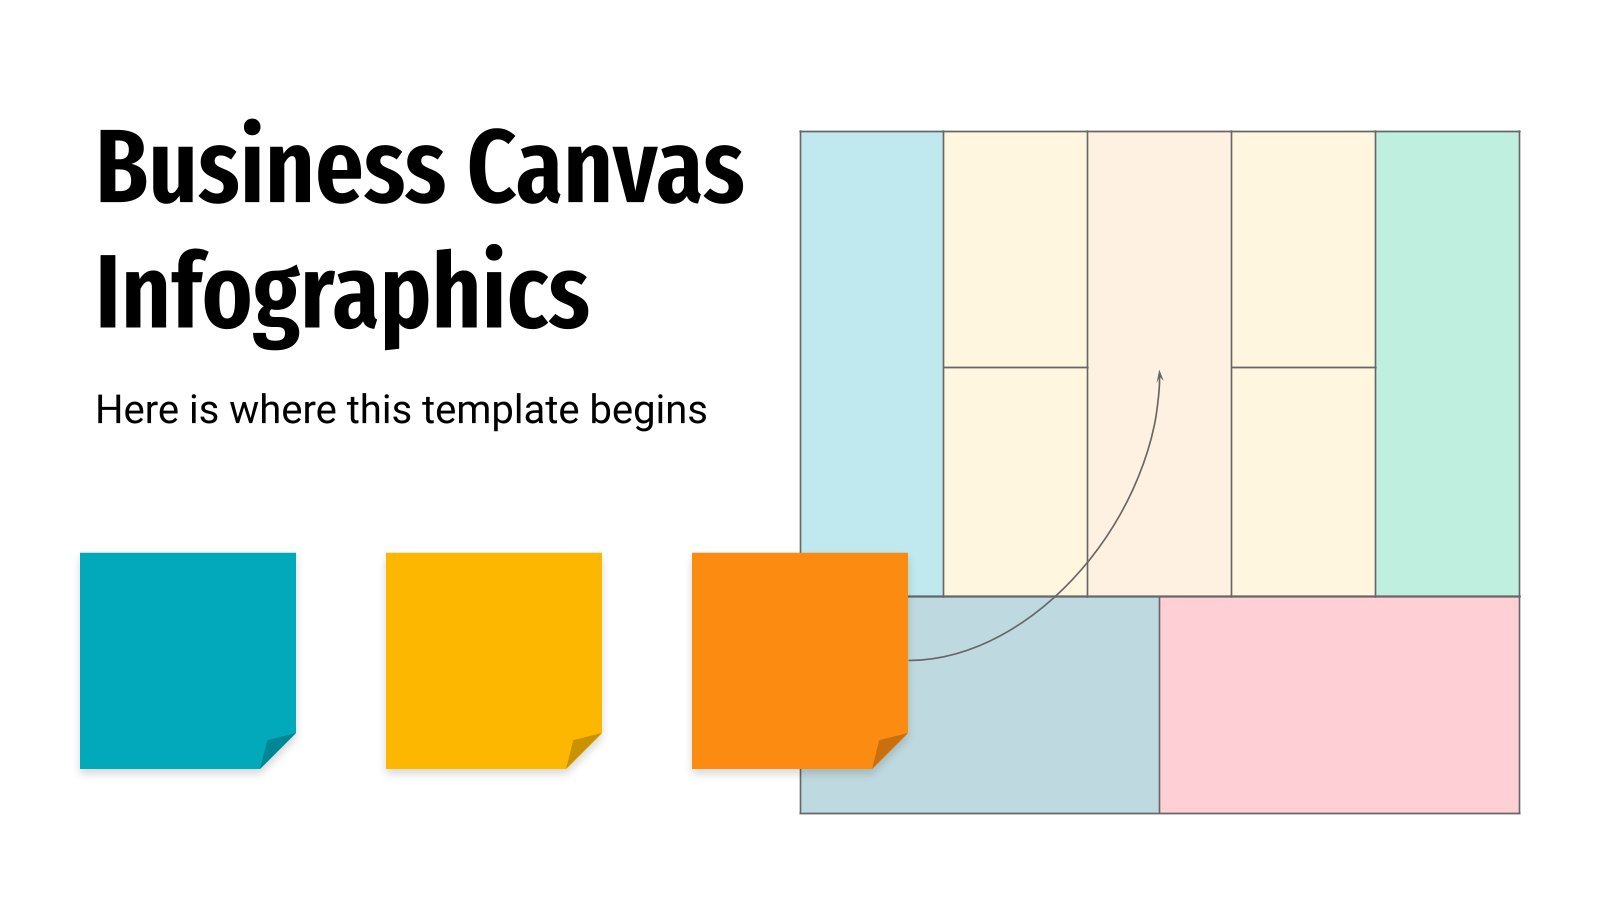
Answer questions like “What will my company do?”, “Who will we help?”, “What will it cost?” or “How will we reach our clients?” with this set of colorful infographics made so that the way to success is a clear path for you and your company. The 32 infographics show different...
Download the Dashboard Infographics template for PowerPoint or Google Slides to get the most out of infographics. Whether you want to organize your business budget in a table or schematically analyze your sales over the past year, this set of infographic resources will be of great help. Start using infographics...

Our collection of infographics grows a little bit today with the addition of this new template about the value proposition canvas, a model in which you market a product that solves the needs of certain customers, "alleviates their pain" and offers added value to them. It's very popular in business,...

Download the Last Week of School Infographics template for PowerPoint or Google Slides and discover this set of editable infographics for education presentations. These resources, from graphs to tables, can be combined with other presentations or used independently. The most important thing is what you will achieve: transmit information in...
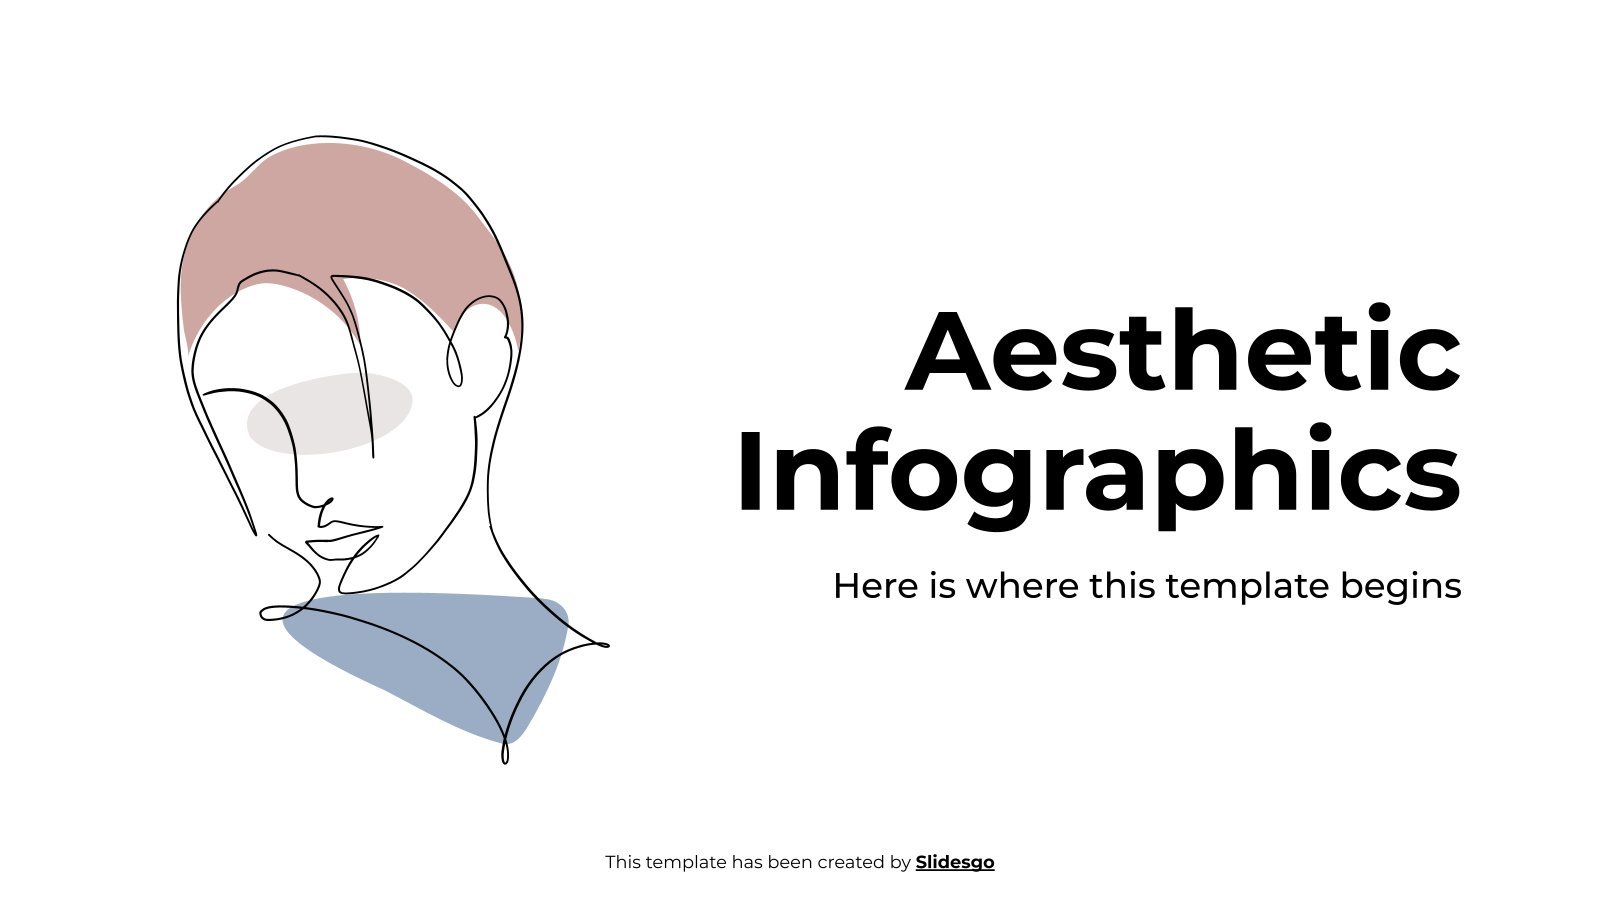
Download the "Aesthetic Infographics" template for PowerPoint or Google Slides and discover the power of infographics. An infographic resource gives you the ability to showcase your content in a more visual way, which will make it easier for your audience to understand your topic. Slidesgo infographics like this set here...

Download the Biography Infographics presentation for PowerPoint or Google Slides. The world of business encompasses a lot of things! From reports to customer profiles, from brainstorming sessions to sales—there's always something to do or something to analyze. This customizable design, available for Google Slides and PowerPoint, is what you were...

You may find keeping track of multiple metrics at the same time a bit difficult, especially if you need to have everything at the same place and ready to be seen at a glance. That is the purpose of the aptly named dashboard infographics. Have a look at this single...