Dashboard Infographics Presentation templates
When keeping track of multiple metrics at the same time, you need as much clarity as possible. Many vehicles and pieces of machinery have a dashboard, displaying information that can be monitored at a glance. You can do the same when giving business or marketing presentations, because Slidesgo has a good assortment of dashboard infographics. All of them are easily editable!


It seems that you like this template!

Register for free and start downloading now
Download the Dashboard Infographics template for PowerPoint or Google Slides and discover the power of infographics. An infographic resource gives you the ability to showcase your content in a more visual way, which will make it easier for your audience to understand your topic. Slidesgo infographics like this set here...

Download the Dashboard Infographics presentation for PowerPoint or Google Slides and start impressing your audience with a creative and original design. Slidesgo templates like this one here offer the possibility to convey a concept, idea or topic in a clear, concise and visual way, by using different graphic resources. You...
Download the Dashboard Infographics template for PowerPoint or Google Slides to get the most out of infographics. Whether you want to organize your business budget in a table or schematically analyze your sales over the past year, this set of infographic resources will be of great help. Start using infographics...
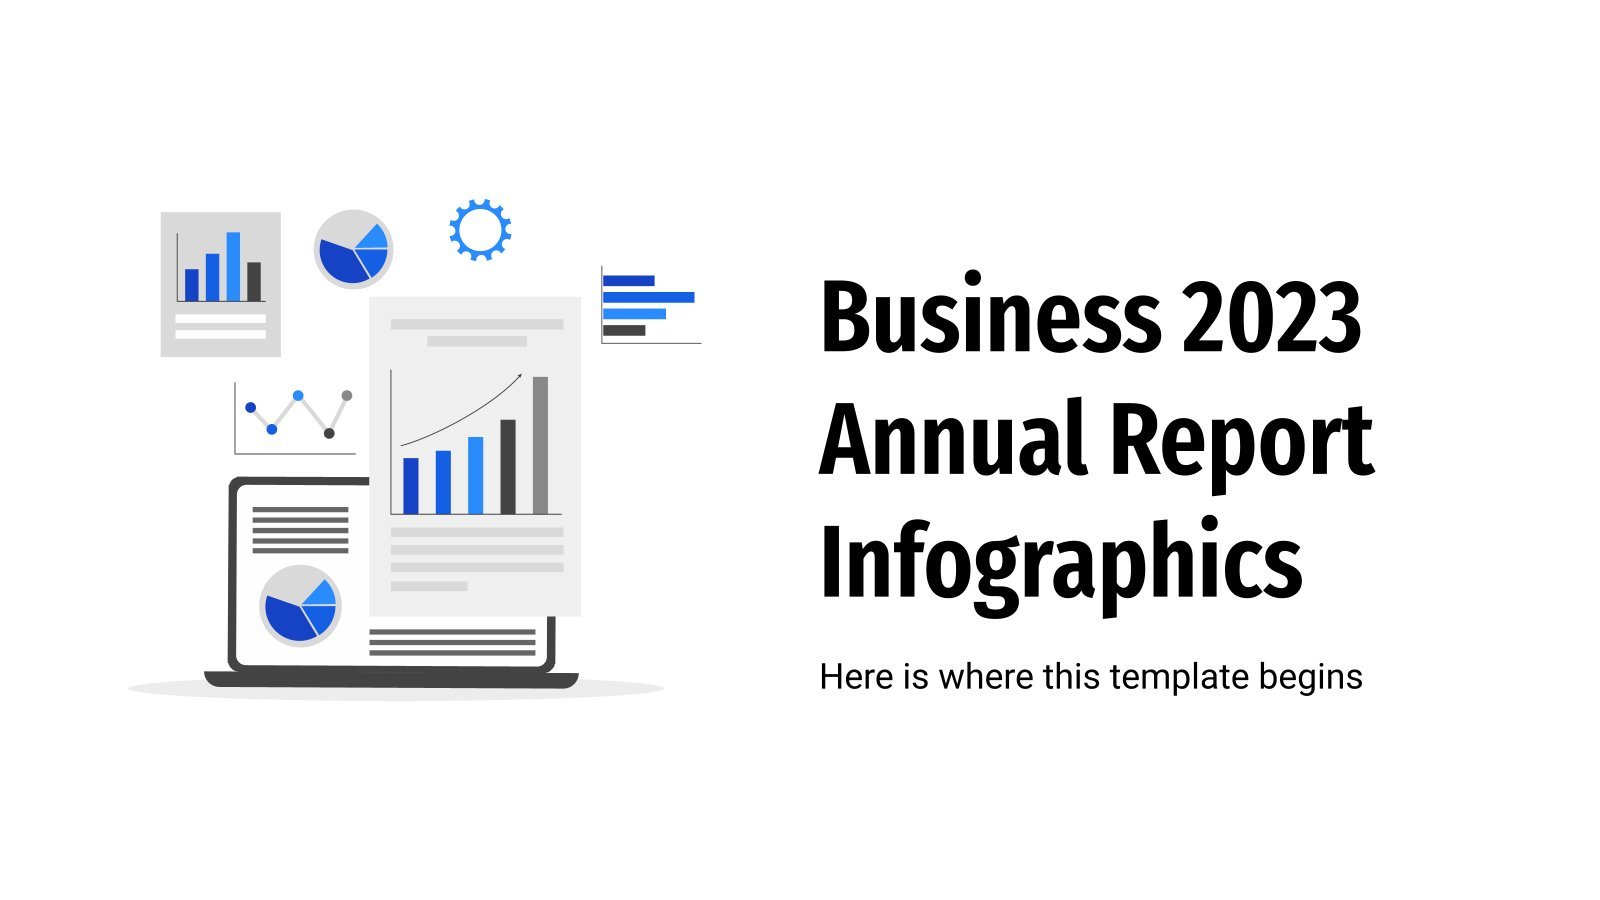
How did you company do during this year? Annalise your spendings, liabilities, earnings, profits, investments, etc. with this set of business infographics made for people who want to increase their productivity! They’re very easy to use and will help your company understand its achievements and its mistakes, to learn from...

Do you want to assess the success or failure of your company? Use these KPI (Key Performance Indicators). It is a great tool to determine if you are achieving a goal or not. Represent your information about actions, strategies or productivity with bar or pie charts, pyramids, tables, percentages, maps......

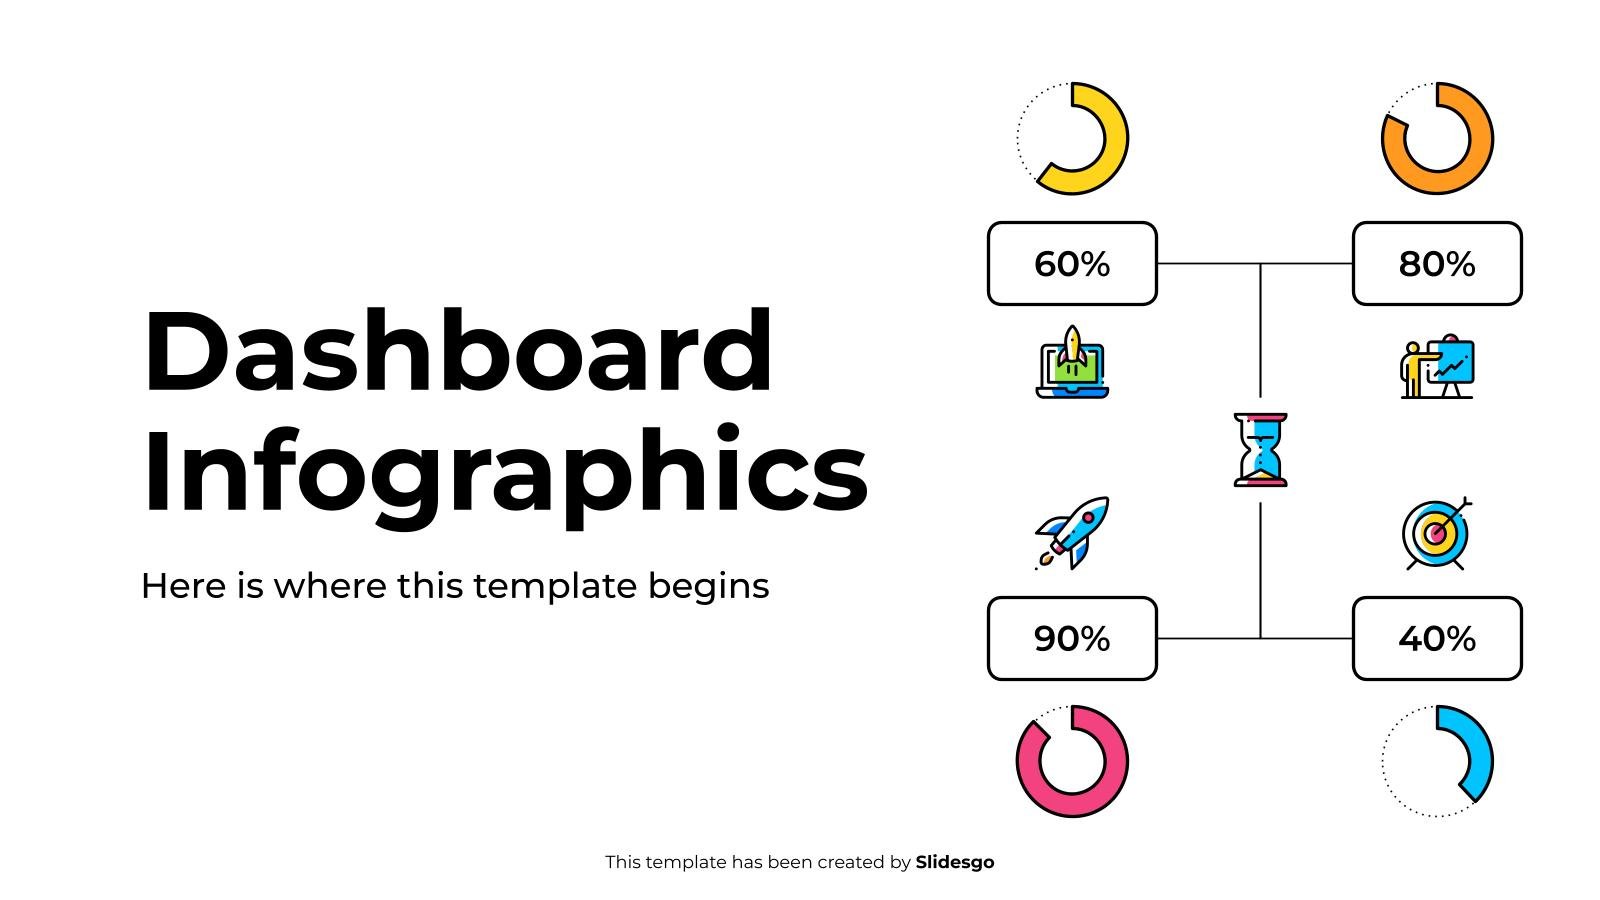
Understanding big blocks of information can be hard, but how about you represent it in the form of a dashboard? Make use of our designs now to do so! All our slides have been designed in a linear style, meaning the shapes have no fill color. Bar graphs, pie charts,...

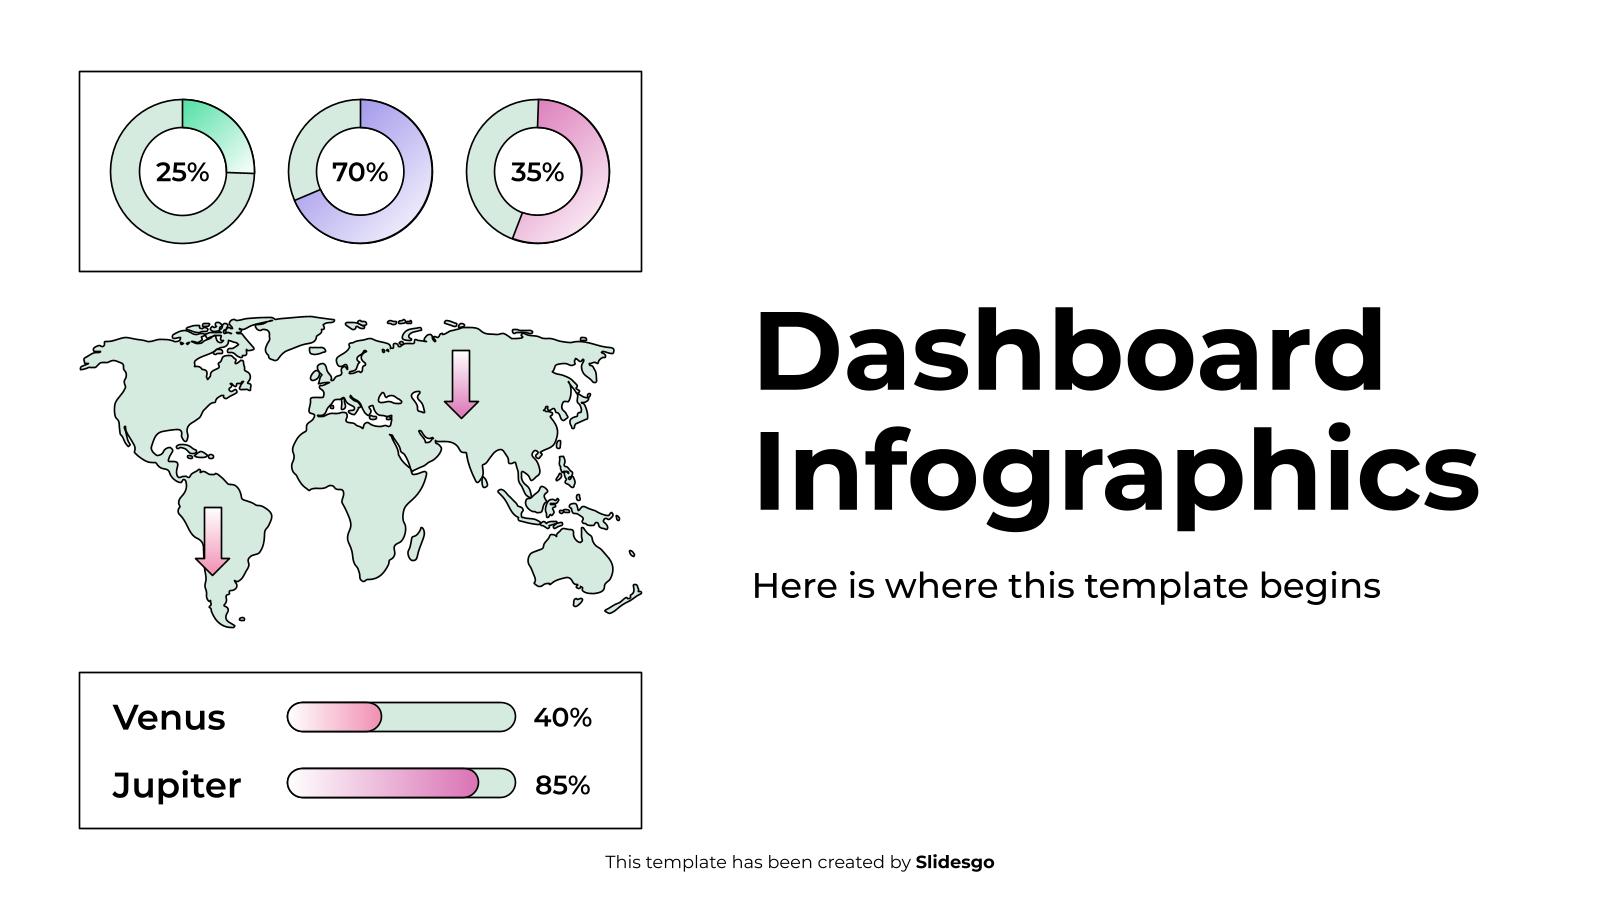
Show on your slides all the information obtained through key performance indicators or KPIs and let your colleagues make sense of it thanks to these free infographics. The main attraction point of this set is the use of gradients in all the designs. Lots of maps, charts and columns are...
Download the Dashboard Infographics template for PowerPoint or Google Slides to get the most out of infographics. Whether you want to organize your business budget in a table or schematically analyze your sales over the past year, this set of infographic resources will be of great help. Start using infographics...

You may find keeping track of multiple metrics at the same time a bit difficult, especially if you need to have everything at the same place and ready to be seen at a glance. That is the purpose of the aptly named dashboard infographics. Have a look at this single...

Download the Dashboard Infographics template for PowerPoint or Google Slides to get the most out of infographics. Whether you want to organize your business budget in a table or schematically analyze your sales over the past year, this set of infographic resources will be of great help. Start using infographics...

Looking for a fancy way to show how a project is performing? Our dashboard infographics convey so much information at a glance they could be used independently too! The visuals are very powerful due to the gradients and the wide array of different charts, graphs and other resources for tracking...

Showing your data in a visual way is key to understanding the info in a suitable way. Make use of our dashboards now to do so! Have a look at these flat steps, blocks, bar and pie charts, maps, budgets and result slides. They include many sections and are perfect...

Before establishing your strategies and actions you have to be very clear about your business objective. Once you have this analysis, you can decide what actions will help you achieve that goal. And when you have developed them, the first thing you should do is define what the KPIs are,...
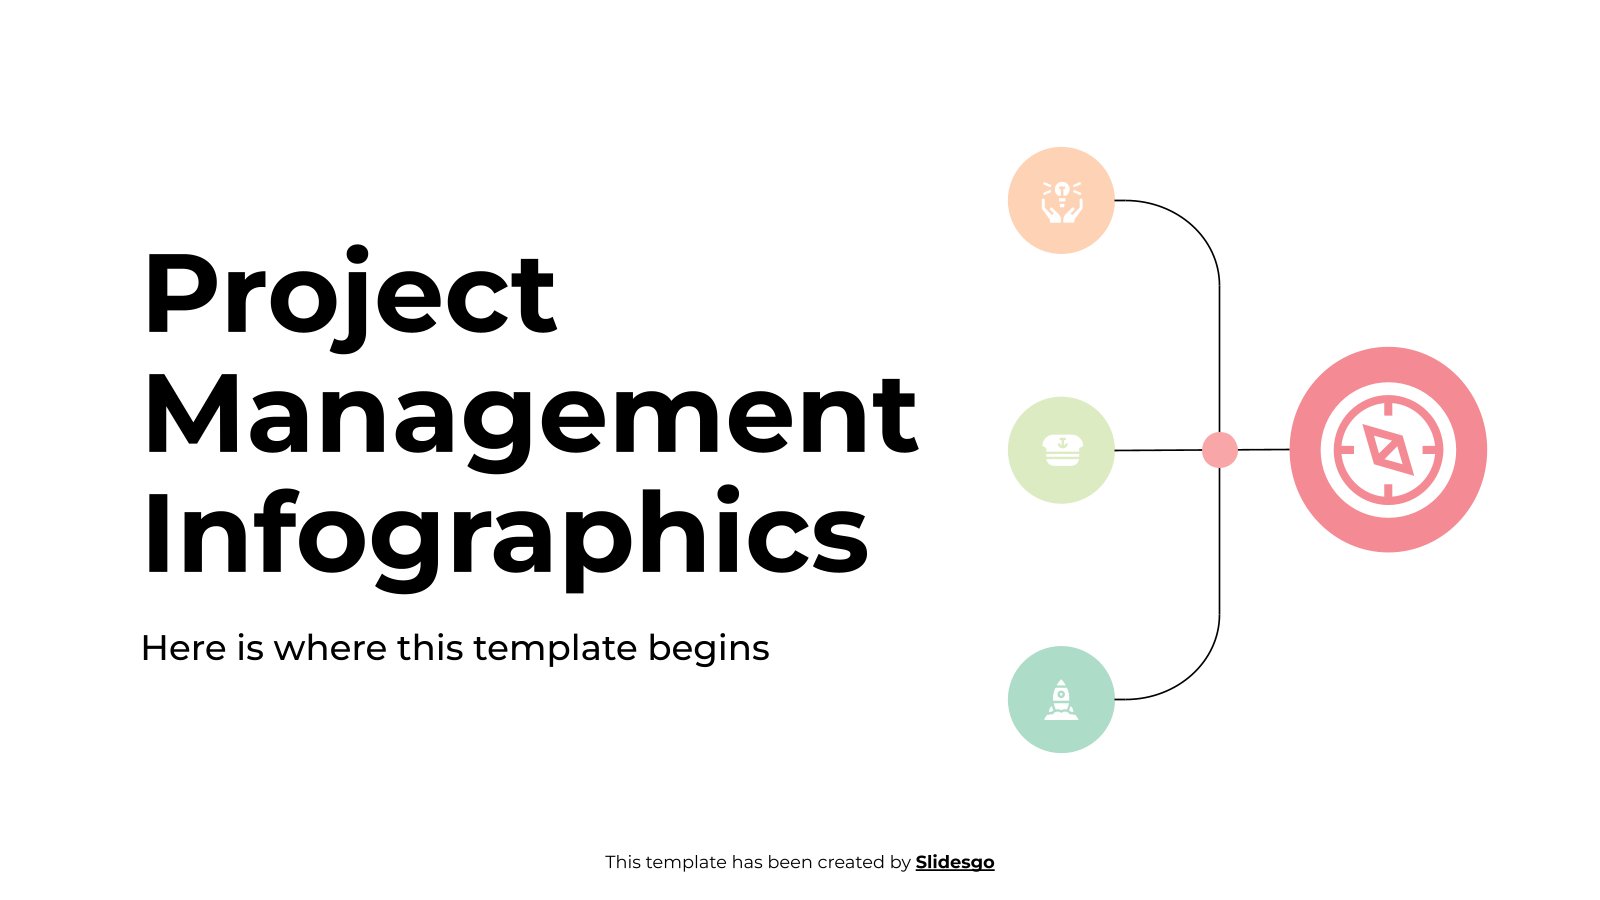
Download the "Project Management Infographics" template for PowerPoint or Google Slides to get the most out of infographics. Whether you want to organize your business budget in a table or schematically analyze your sales over the past year, this set of infographic resources will be of great help. Start using...
Download the "Icons Infographics" template for PowerPoint or Google Slides and discover the power of infographics. An infographic resource gives you the ability to showcase your content in a more visual way, which will make it easier for your audience to understand your topic. Slidesgo infographics like this set here...

Download the Dashboard Infographics template for PowerPoint or Google Slides and discover the power of infographics. An infographic resource gives you the ability to showcase your content in a more visual way, which will make it easier for your audience to understand your topic. Slidesgo infographics like this set here...
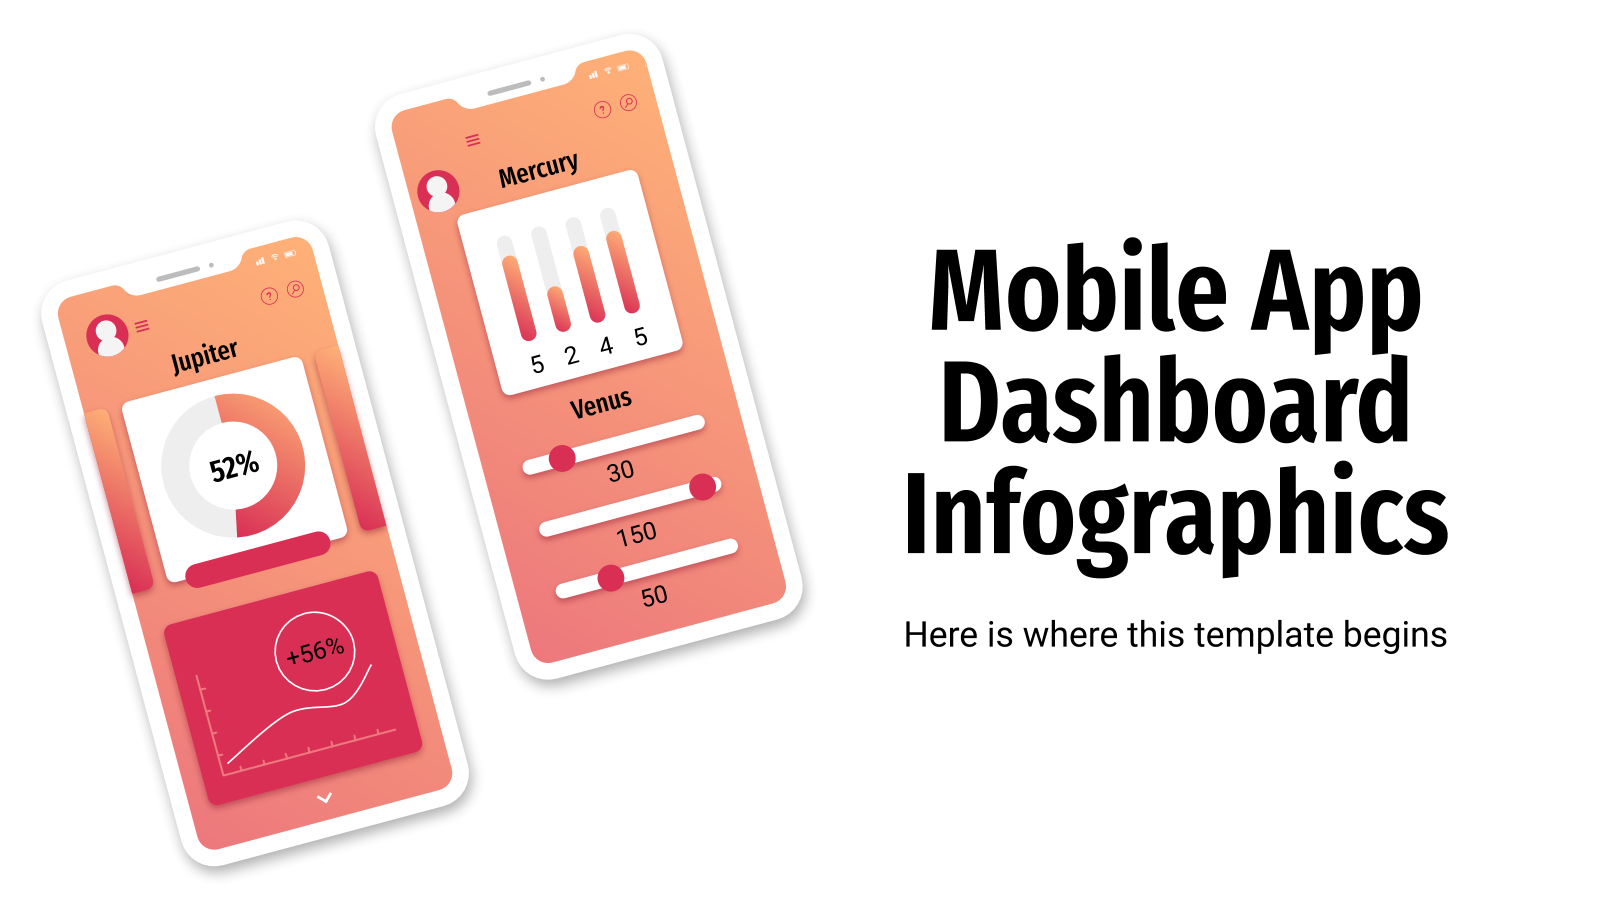
Do you want to be original when presenting information? Infographics are a powerful resource, but how about showing your data like if it were in a mobile app's dashboard? Complete with gauges, icons, gradients and silhouettes of cellphones, these designs will convey visually all the numbers, stats and key performance...

Defining KPIs is essential to measure the results of your marketing, business and sales strategies. These indicators must respond to SMART objectives: specific, measurable, achievable, relevant and time-limited. This template contains a great variety of graphic resources to show the fulfillment of your goals. Icons, infographics, tables, diagrams and graphs...