Business Presentation templates - Page 338
Engage your audience in your business presentations with our free customizable PPT templates and Google Slides themes. They’re perfect for business plans, office meetings, pitch decks or project proposals.


It seems that you like this template!

Register for free and start downloading now
When it comes to the world of radio and broadcasting, podcasts are very popular content, since you can listen to them whenever you want, without having to follow a schedule. Use these editable infographics to talk about radio and podcasts as a whole. All these designs, including diagrams, tables and...

Streaming platforms are very much on the agenda because they have become our way of watching TV shows and movies. There are many of these platforms, but now it's your turn to take the market by storm! If you are looking for investors, Slidesgo brings you a Pitch Deck presentation...

Download the Personal Branding Portfolio presentation for PowerPoint or Google Slides. When a potential client or employer flips through the pages of your portfolio, they're not just looking at your work; they're trying to get a sense of who you are as a person. That's why it's crucial to curate...

Cryptocurrency is a relatively new concept, but more and more people are becoming familiarized with it. Are you one of the chosen ones that know everything about cryptocurrency? This template that we bring you today is perfect for creating a CV. We have used different colors for the backgrounds, and...

When a company is about to launch a new product, it is very useful to perform a SWOT analysis to identify the strengths, weaknesses, opportunities and threats to that product. A SWOT analysis can also be used to correct mistakes in future launch campaigns. To make your SWOT analysis very...

Brainstorming is a technique in which you and your team try to come up with new ideas to solve a problem and it’s a great way of fostering creativity and teamwork. With this set of infographics, you can represent visually the ideas that your team comes up with and organize...

Download the Diagram Infographics template for PowerPoint or Google Slides to get the most out of infographics. Whether you want to organize your business budget in a table or schematically analyze your sales over the past year, this set of infographic resources will be of great help. Start using infographics...

Download the Steps Infographics template for PowerPoint or Google Slides to get the most out of infographics. Whether you want to organize your business budget in a table or schematically analyze your sales over the past year, this set of infographic resources will be of great help. Start using infographics...

Download the SWOT Analysis Infographics template for PowerPoint or Google Slides to get the most out of infographics. Whether you want to organize your business budget in a table or schematically analyze your sales over the past year, this set of infographic resources will be of great help. Start using...

Do you know everything related to the book industry? All about writers, publishers, distributors, editors? We're eager to see what kind of portfolio you can create with this Google Slides and PowerPoint template. The design is actually quite versatile, and the features that are most noticeable are the use of...
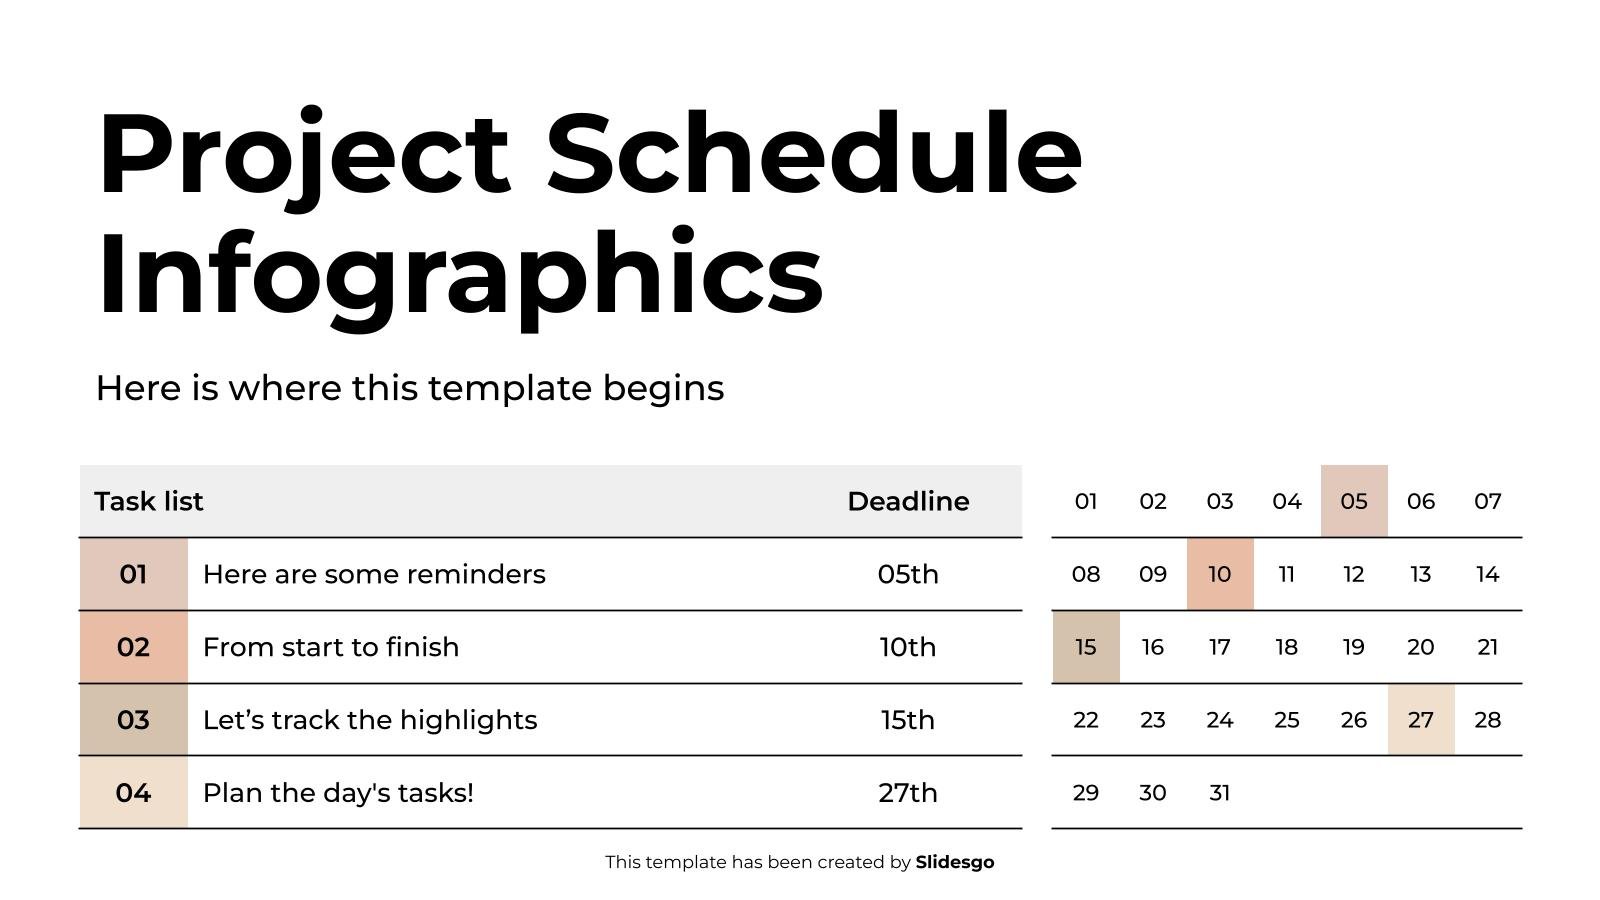
Download the Project Schedule Infographics template for PowerPoint or Google Slides to get the most out of infographics. Whether you want to organize your business budget in a table or schematically analyze your sales over the past year, this set of infographic resources will be of great help. Start using...

Have you ever wondered how a prison works? How is it run? The topic is quite interesting, as it's not very usual. Try this template and educate your audience on this matter. The design of the slides is simple to facilitate the addition of content. The palette is composed of...

Ensure your portfolio really pops with this neon aesthetics template! Edit it on Google Slides and PowerPoint, stand out from the pack and make your mark. Its important to showcase your work in the most flattering way possible, and this slideshow full of sculptures helps you achieve just that. So...

If you live and breathe inbound marketing, this infographics template will suit you to a T and then some. Make sure to download it and edit it on Google Slides and PowerPoint, and turn your presentation into a stylish data-driven pitch for your work. Whatever it is you want to...

Your business meetings will be more fun than ever thanks to this template that we propose today. It has a formal look in terms of color, as we have used black and white, two classics that never fail, especially when it comes to business topics. The original touch is provided...

Download the AI Tech Infographics template for PowerPoint or Google Slides to get the most out of infographics. Whether you want to organize your business budget in a table or schematically analyze your sales over the past year, this set of infographic resources will be of great help. Start using...

"Find a job you like and you will never have to work a day in your life". As Confucius said, being able to dedicate ourselves to what we really like and are passionate about is a privilege we should all experience. If you are looking for a job, this resume...

The recruitment process and job finding in general has changed drastically due to the pandemic and now everything happens online. For some, this is a new world they need to adapt to and having someone explain it to them with a visual infographic is going to be very appreciated! Use...