Business Infographics Presentation templates - Page 15
Thinking about new techniques to improve your company performance? Try our effective infographics for Google Slides and PowerPoint and present your data and results easily!


It seems that you like this template!

Register for free and start downloading now
Biodata is, to put it simply, information about life, work experience and education of a certain person. Do you think that this can be useful for recruiting processes or when choosing who to order a commission? These infographics are, firstly, totally customizable, and secondly, ideal for showing profiles with biodata....
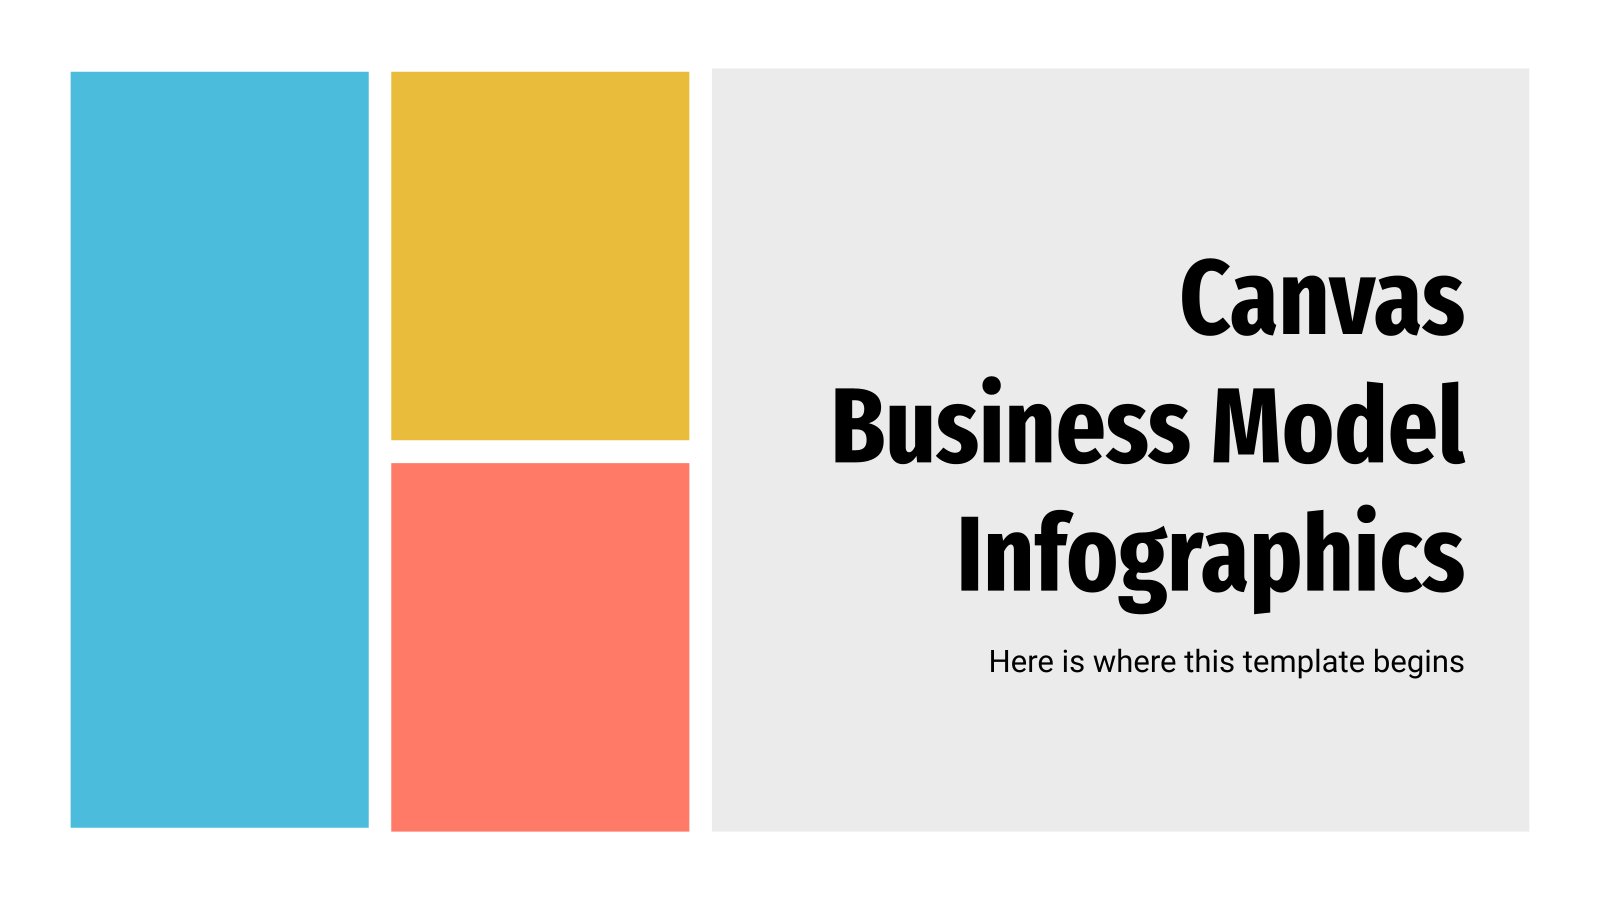
The Canvas Business Model was created by Swiss entrepreneur and author Alexander Osterwalder. It is a widely used template for developing new business models. If you are also creating yours, take a look at this infographic template inspired by this strategic management model that will help you put your ideas...

Download the A/B Testing Infographics template for PowerPoint or Google Slides to get the most out of infographics. Whether you want to organize your business budget in a table or schematically analyze your sales over the past year, this set of infographic resources will be of great help. Start using...

Imagine this: a swirling vortex of information that leads you straight down a path to success. That's the power of a great funnel infographic. With a little bit of creativity, these editable visual aids can guide potential customers through the twists and turns of the decision-making process with ease. And...

If you know English, you might know what the 5W's refer to. Now, let's add a couple of H's to the mix. Now you have all the elements together: who, what, when, where, why, how and (especially in the business world) how much. Seven key questions that need some answers...

Download the Project Roadmaps Infographics template for PowerPoint or Google Slides to get the most out of infographics. Whether you want to organize your business budget in a table or schematically analyze your sales over the past year, this set of infographic resources will be of great help. Start using...
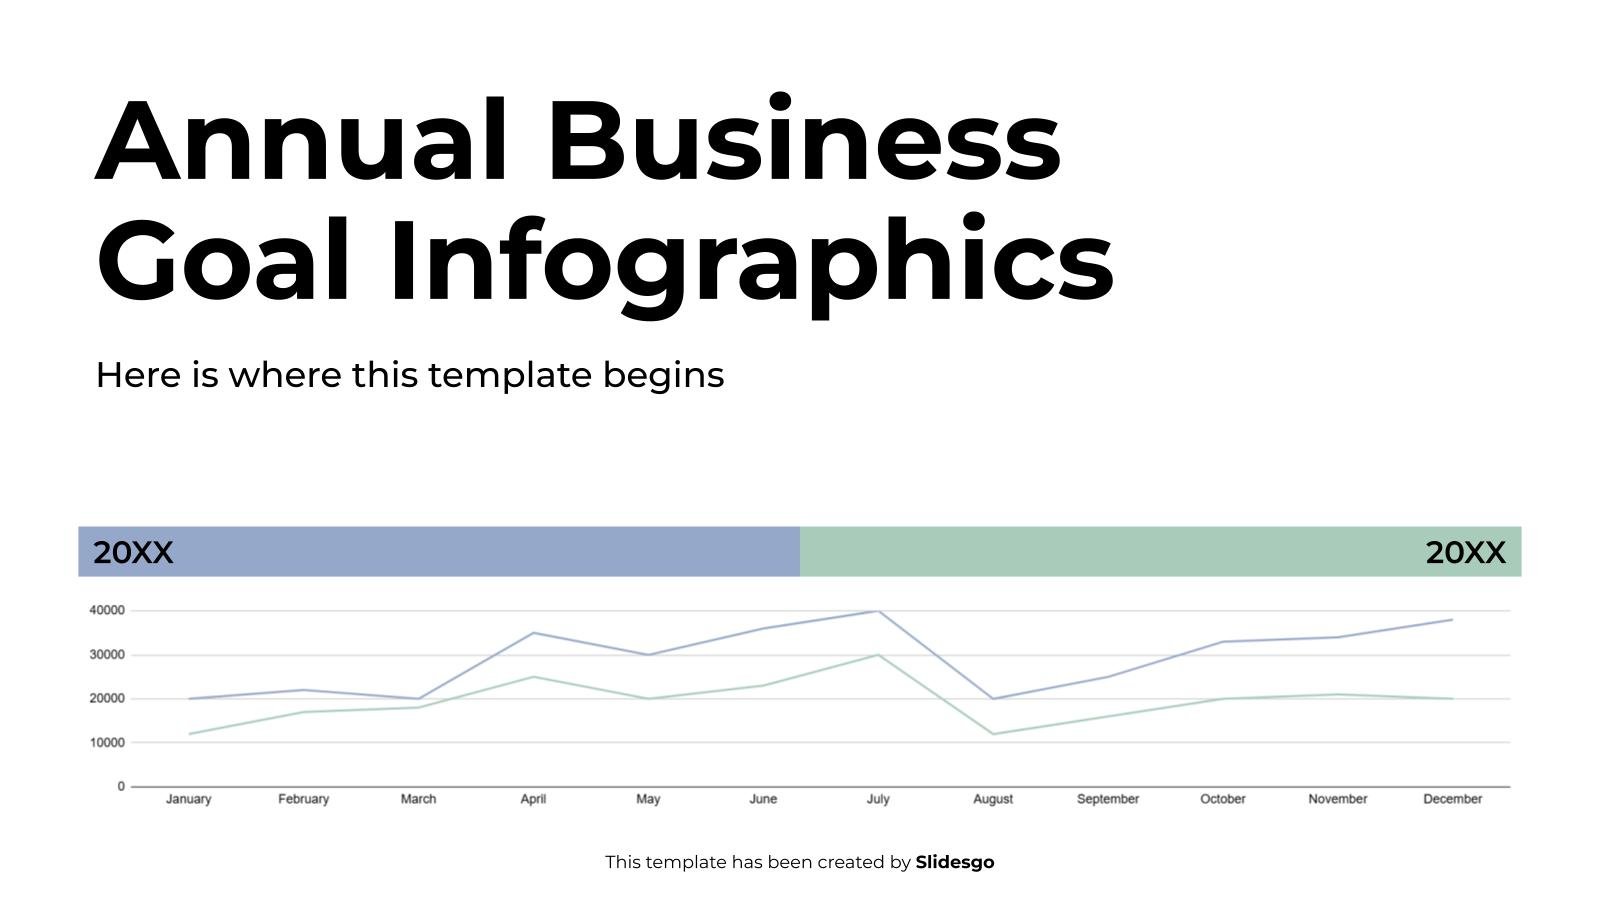
Download the Annual Business Goal Infographics template for PowerPoint or Google Slides to get the most out of infographics. Whether you want to organize your business budget in a table or schematically analyze your sales over the past year, this set of infographic resources will be of great help. Start...

Download the Smart Goals Infographics template for PowerPoint or Google Slides to get the most out of infographics. Whether you want to organize your business budget in a table or schematically analyze your sales over the past year, this set of infographic resources will be of great help. Start using...

Do you know how the acronym RAPID is formed? It comes from "recommend", "agree", "perform", "input" and "decide". These words create RAPID, which is a decision-making model for companies. With this model you can organize the decision-making process from start to finish. So, we have designed this set of infographics...
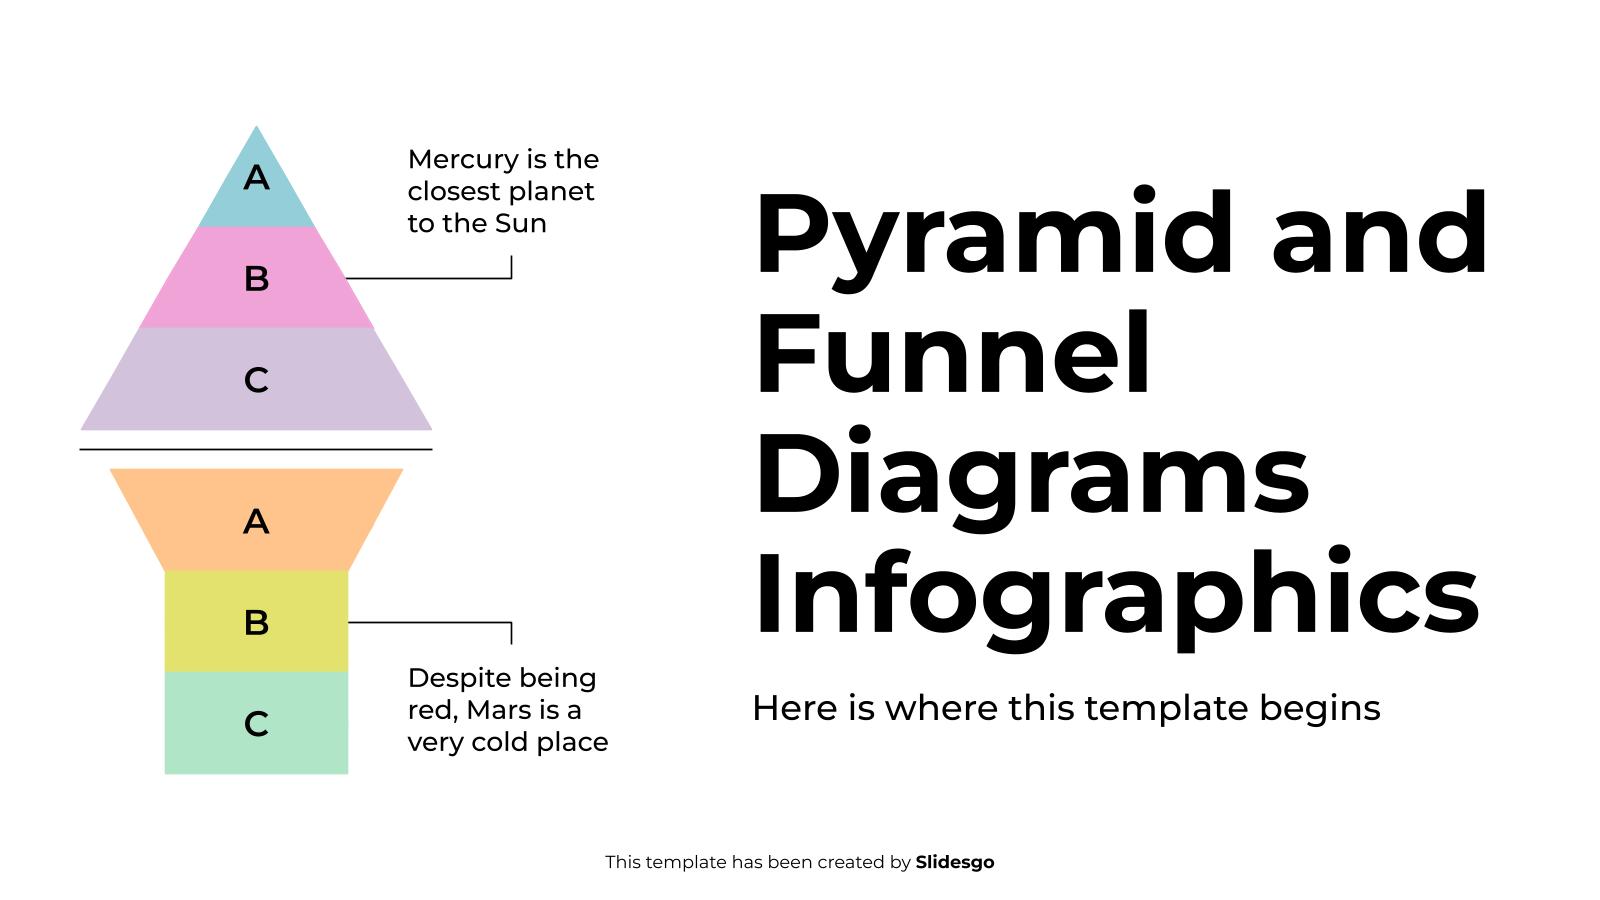
Download the Pyramid and Funnel Diagrams Infographics template for PowerPoint or Google Slides to get the most out of infographics. Whether you want to organize your business budget in a table or schematically analyze your sales over the past year, this set of infographic resources will be of great help....

Download the Steps to Success Infographics template for PowerPoint or Google Slides to get the most out of infographics. Whether you want to organize your business budget in a table or schematically analyze your sales over the past year, this set of infographic resources will be of great help. Start...

List the most importantyour milestones related to your company or marketing campaign with these infographics. You’ll find timelines, roadmaps or steps with a flat design. They include many sections!

It’s very important to represent data in a very visual way so it doesn’t get confusing. Relevant information, such as numbers, need to be really well portrayed. So we have opted with black and white infographics with a scrapbook style. It is so formal and elegant, that everything will look...
Download the "Fertilizer Allowances Meeting Infographics" template for PowerPoint or Google Slides and discover the power of infographics. An infographic resource gives you the ability to showcase your content in a more visual way, which will make it easier for your audience to understand your topic. Slidesgo infographics like this...

To know where to focus the product and identify customer needs, one of the most useful marketing techniques to employ is the customer journey. Through this process, you identify an area where the ideal customer profile (the buyer persona) has a need and start working from there. To help you...

In business, it’s important to compare qualities, features and prices of different products or services in the market. Use these free infographics to stand out from the competition and talk about market share, strengths, weaknesses, profit and many more essential info for your colleagues or higher-ups!
Are you ready for change? A true leader is always ready to change his way of acting if it will mean the absolute triumph of the group, but he needs the right tools to do it! And these infographics are perfect for change management in any kind of business organization!...
Describe how a product is manufactured in a visual manner with our infographics. Most of our slides show processes or steps, and for that we’ve used circular designs, but there are also roadmaps and tables. What a way to make your presentations stand out!