Marketing Infographics Presentation templates - Page 2
Anticipate and satisfy your customers' needs creating marketing infographics with your own information! Get ready to get more and more clients showing your data and information with great diagrams!

It seems that you like this template!

Register for free and start downloading now
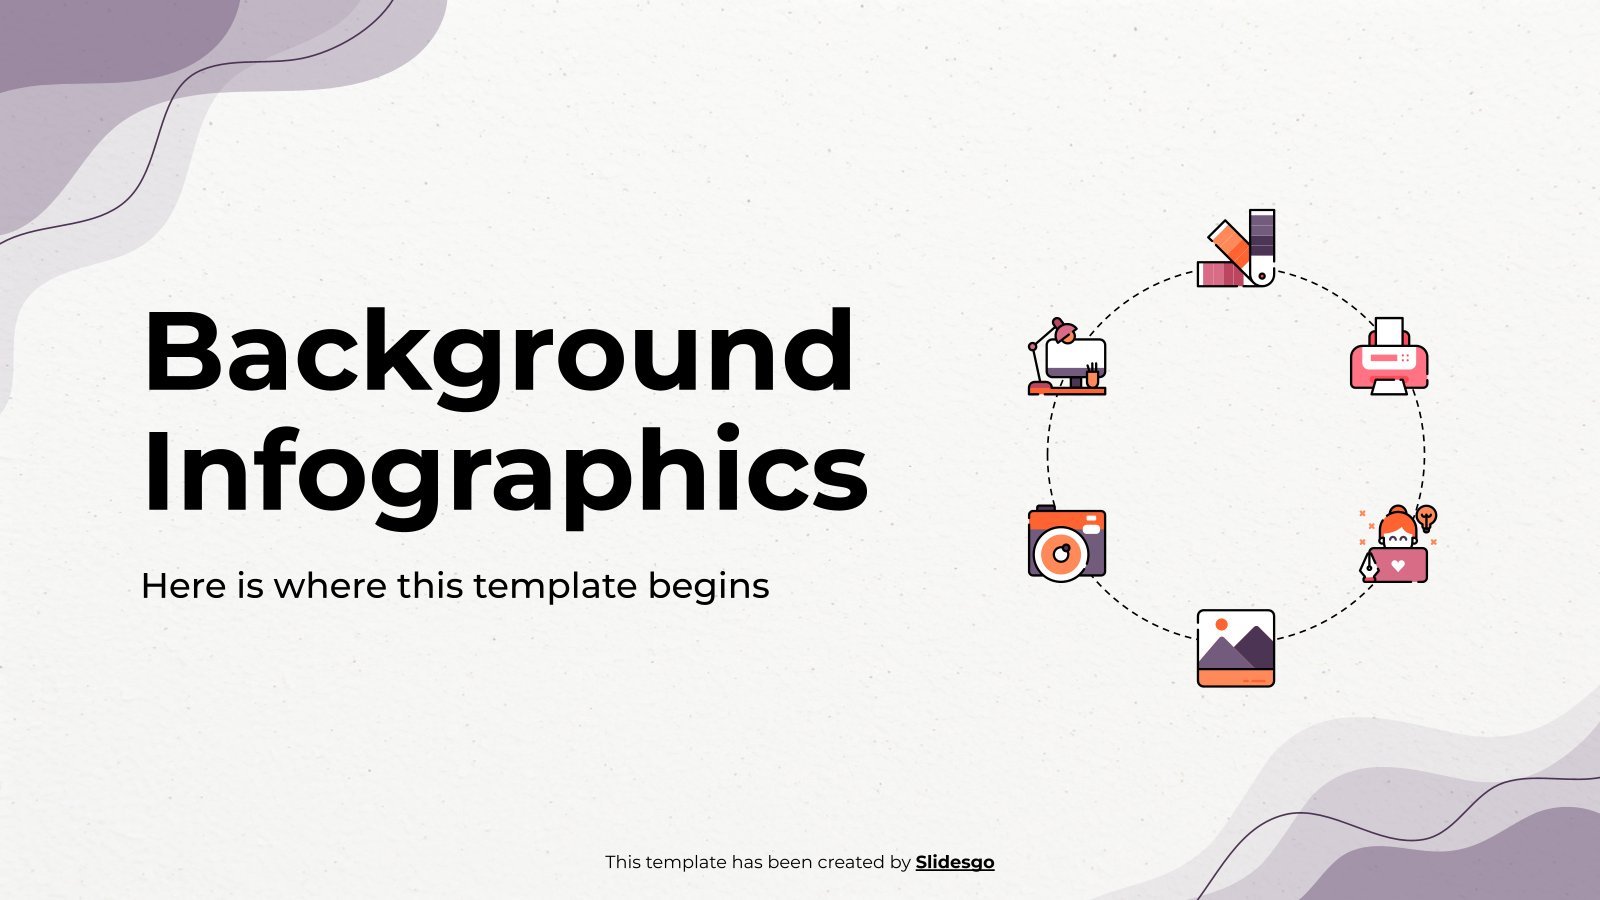
Download the Background Infographics presentation for PowerPoint or Google Slides. High school students are approaching adulthood, and therefore, this template’s design reflects the mature nature of their education. Customize the well-defined sections, integrate multimedia and interactive elements and allow space for research or group projects—the possibilities of this engaging and...

Understanding big blocks of information can be hard, but how about you represent it in the form of a dashboard? Make use of our designs now to do so! All our slides have been designed in a linear style, meaning the shapes have no fill color. Bar graphs, pie charts,...

If you use neutral tones in your marketing plan, we are sure that you will succeed. And why is that? Well, let's see, don't interpret it literally, we are sure that if you use other tones you will also do well. The important thing is two aspects: the right content...
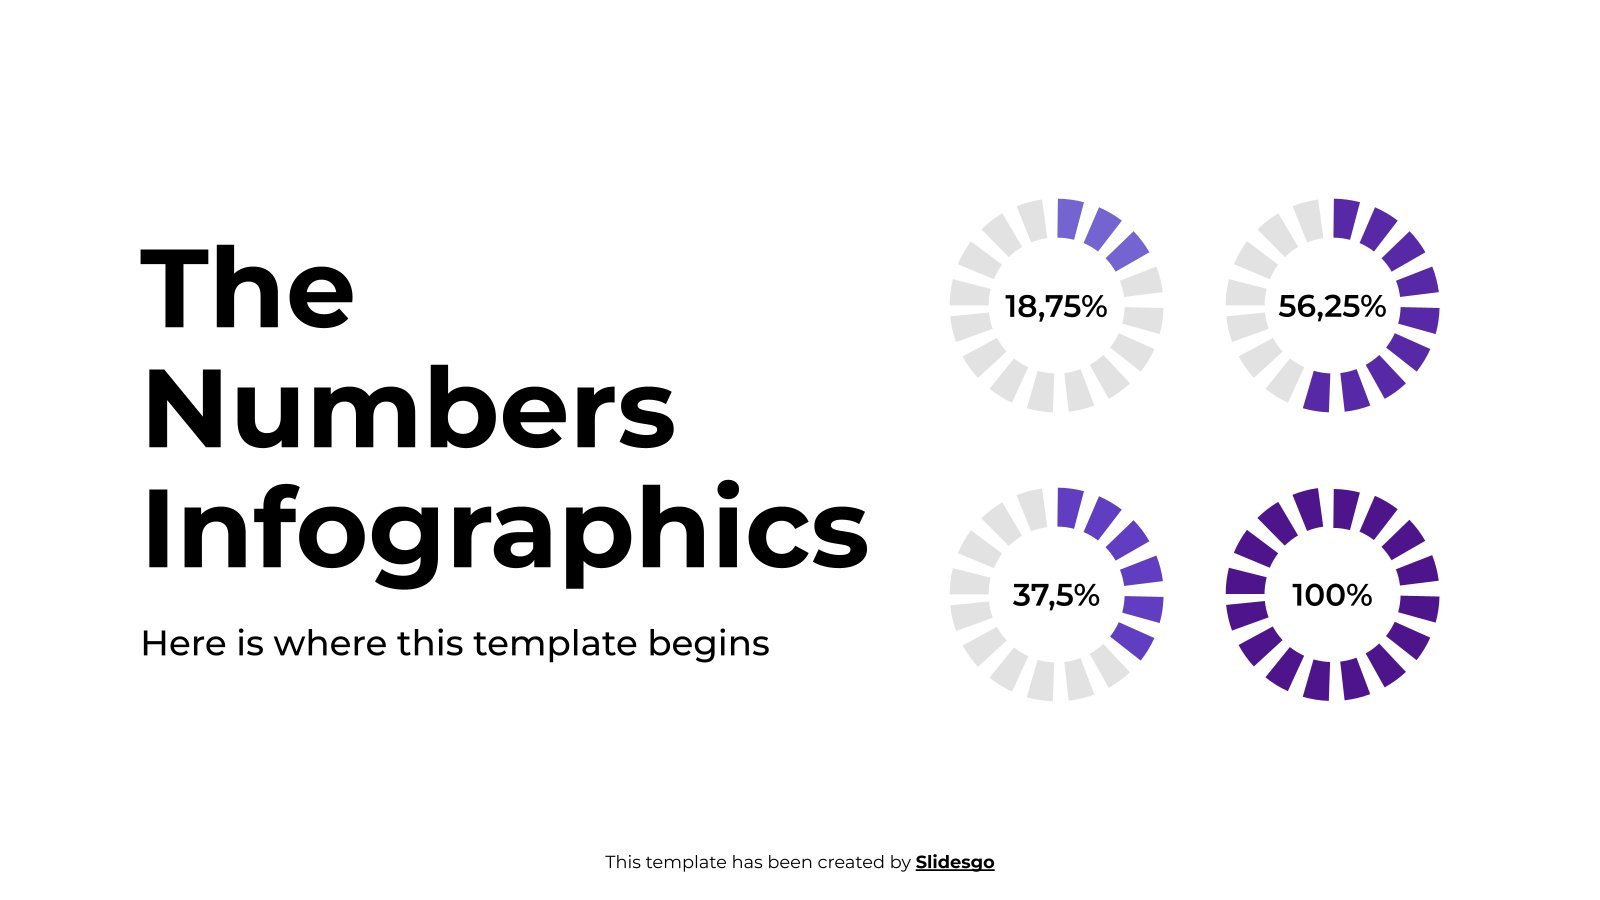
Download the "By The Numbers Infographics" template for PowerPoint or Google Slides and discover the power of infographics. An infographic resource gives you the ability to showcase your content in a more visual way, which will make it easier for your audience to understand your topic. Slidesgo infographics like this...

We know that planning the strategy for the spring sales of your self-care products is not an easy task, that's why we wanted to give you a hand by creating this complete and elegant template that contains over 30 different infographics that you can customize with your figures, information and...

Download the Multicolor Marketing Infographics template for PowerPoint or Google Slides and discover the power of infographics. An infographic resource gives you the ability to showcase your content in a more visual way, which will make it easier for your audience to understand your topic. Slidesgo infographics like this set...

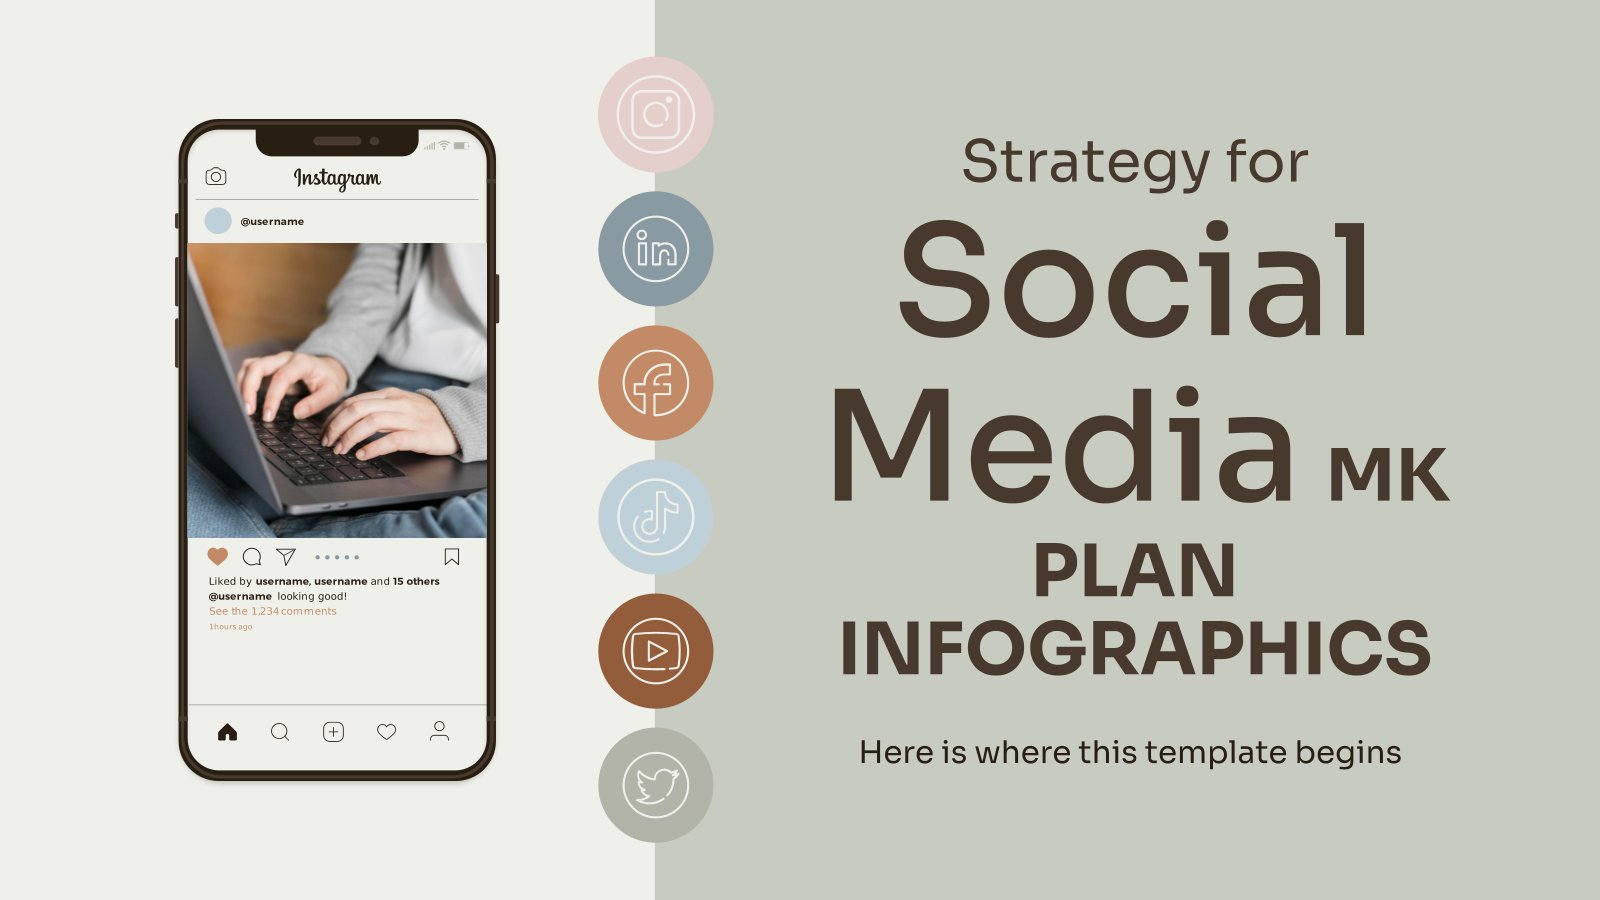
Do you know who is the person with the most followers in the world on Instagram? Of course, being very followed on networks gives you the power to influence all your followers and fans. In marketing, there is a strategy called influencer marketing, which consists of big brands and companies...
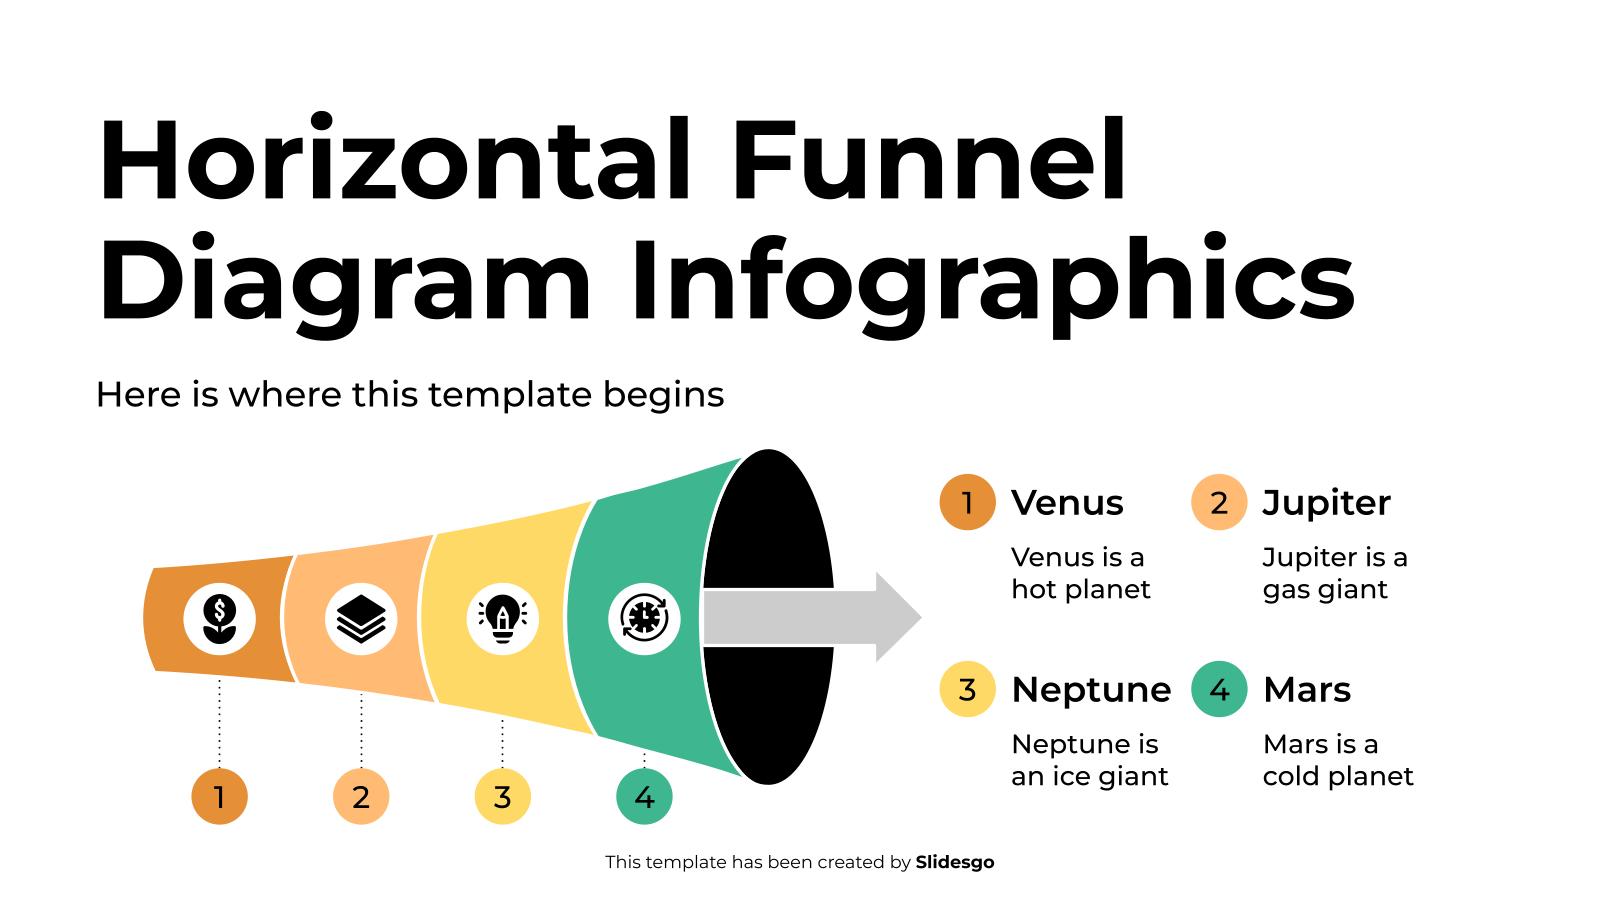
Download the Horizontal Funnel Diagram Infographics template for PowerPoint or Google Slides to get the most out of infographics. Whether you want to organize your business budget in a table or schematically analyze your sales over the past year, this set of infographic resources will be of great help. Start...
Imagine a resource that perfectly presents your marketing plan, but with the added flair of visually stimulating infographics! This set is fully customizable for both Google Slides and PowerPoint, allowing you to adjust aspects to meet your presentation requirements. Show off by eye-catching visuals and present your plan with unquestionable...

Some say that if you’re not on social media, you’re nowhere to be found. Use these free infographics in your digital marketing presentations to talk about these popular sites. Circle charts, blocks of text, a 3D cube, a map, banners—what a wide range of designs we’re offering! There are flat...

Download the Project Roadmap Infographics template for PowerPoint or Google Slides to get the most out of infographics. Whether you want to organize your business budget in a table or schematically analyze your sales over the past year, this set of infographic resources will be of great help. Start using...

Show on your slides all the information obtained through key performance indicators or KPIs and let your colleagues make sense of it thanks to these free infographics. The main attraction point of this set is the use of gradients in all the designs. Lots of maps, charts and columns are...

Download the "Marketing Theme with Cycle Diagrams" presentation for PowerPoint or Google Slides and take your marketing projects to the next level. This template is the perfect ally for your advertising strategies, launch campaigns or report presentations. Customize your content with ease, highlight your ideas and captivate your audience with...
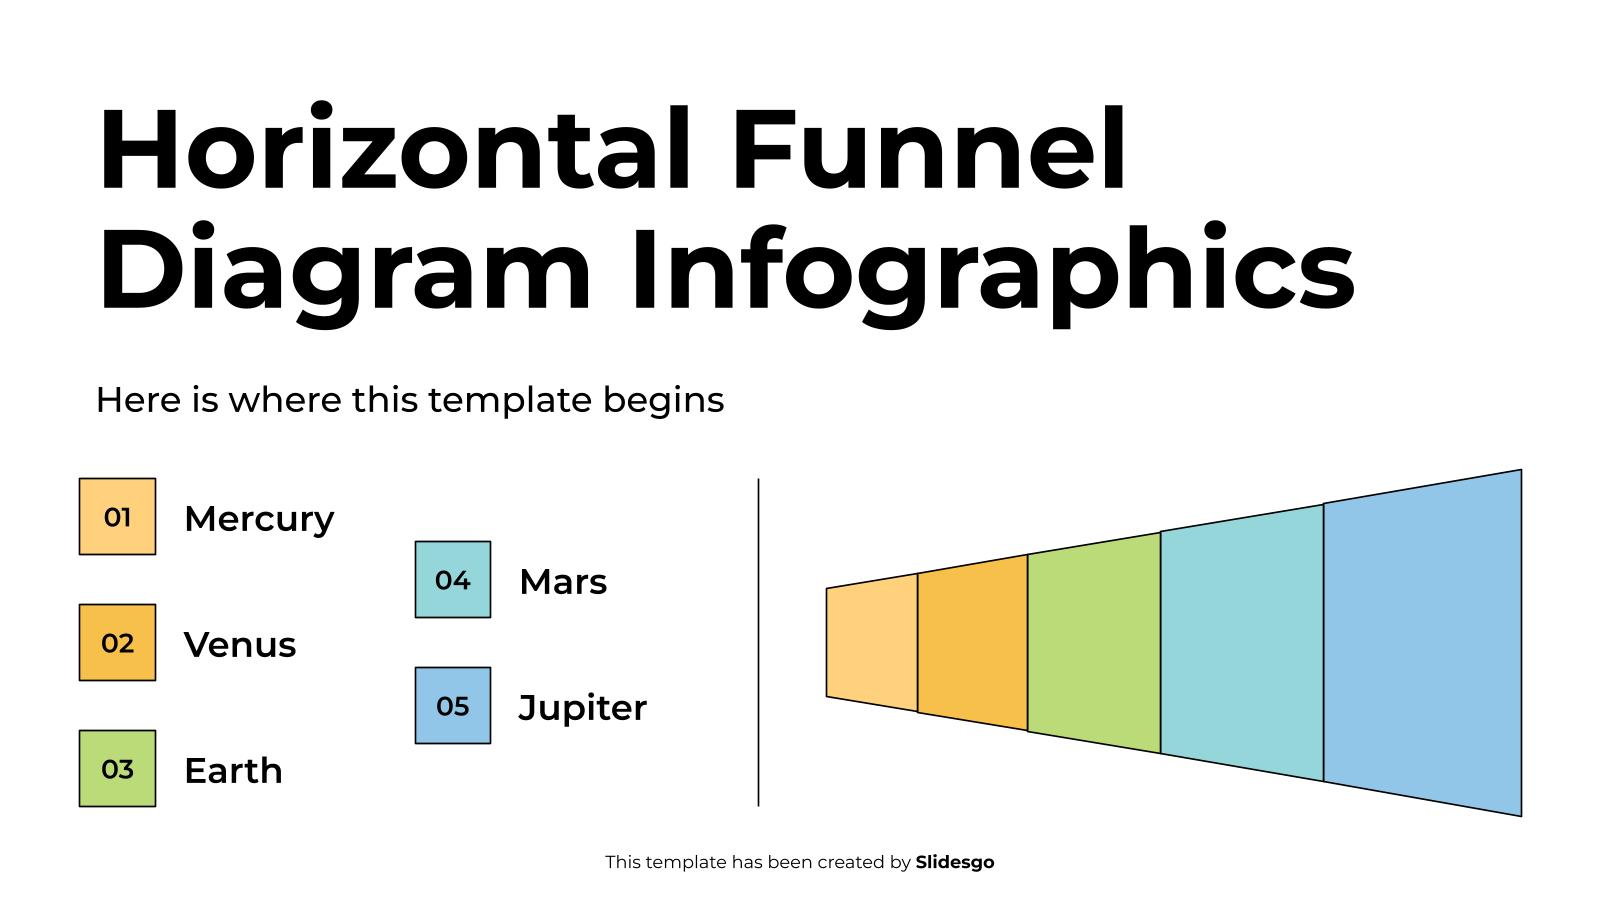
Download the Horizontal Funnel Diagram Infographics template for PowerPoint or Google Slides to get the most out of infographics. Whether you want to organize your business budget in a table or schematically analyze your sales over the past year, this set of infographic resources will be of great help. Start...

What has 2021 left us? Did the economy go up or did it worsen? Did global warming affect temperatures in your country? These infographics are absolutely multi-purpose, as their variety is suitable for a lot of different topics. Are you looking for circular graphs? Or timelines? Maybe a map of...

Download the Tuscany Theme for Marketing Infographics template for PowerPoint or Google Slides and discover the power of infographics. An infographic resource gives you the ability to showcase your content in a more visual way, which will make it easier for your audience to understand your topic. Slidesgo infographics like...

Download the Professional Marketing Infographics template for PowerPoint or Google Slides to get the most out of infographics. Whether you want to organize your business budget in a table or schematically analyze your sales over the past year, this set of infographic resources will be of great help. Start using...

For a product to work 100%, you must understand 100% of the customer's needs. And not only their needs, but also their opinions, understanding who the customer is, identifying their motivations and doubts or looking for the “touchpoints” between the product and the customer. All this study and process is...