Infographics Presentation templates - Page 71
Discover our engaging Google Slides and PowerPoint slides full of infographics to present your information or data clearly and quickly!

It seems that you like this template!
Register for free and start downloading now
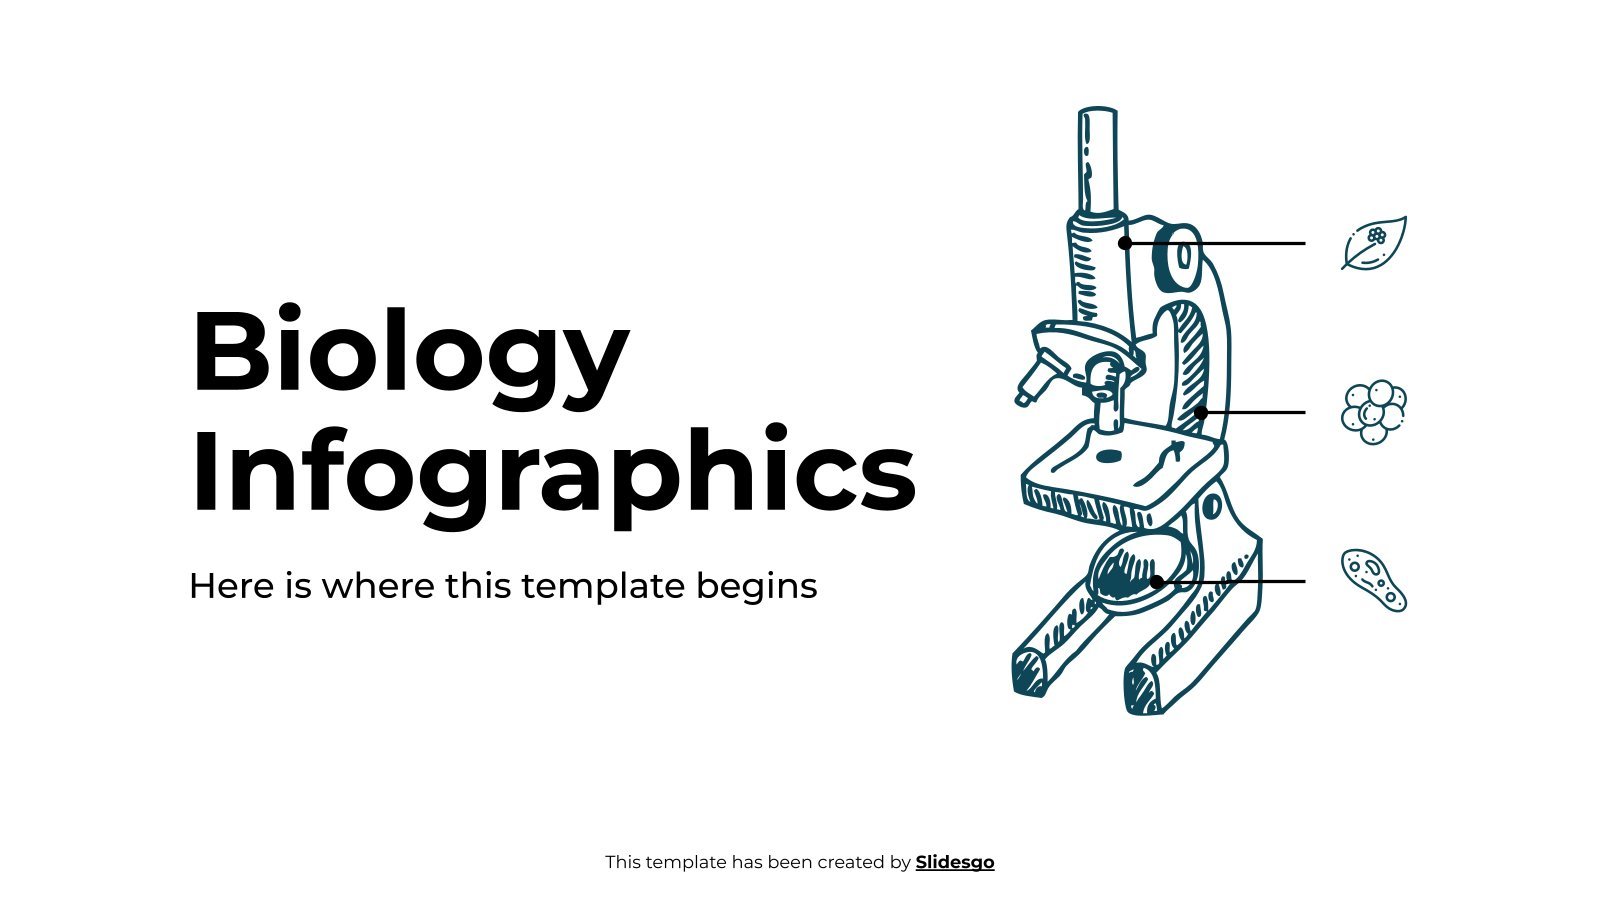
Download the "Biology Infographics" template for PowerPoint or Google Slides and discover this set of editable infographics for education presentations. These resources, from graphs to tables, can be combined with other presentations or used independently. The most important thing is what you will achieve: transmit information in an orderly and...
Use these Mockups Infographics to represent data related to smartphones, computers, tablets and other related devices. Their design is usually flat or filled, and you’ll find text blocks, circle charts, bar charts, banners and 3 to 6 sections.
In business or marketing, demographic data is essential to better understand the target audience. Use these infographics to show yours in a clear manner! Make comparisons, add percentages and organize everything in our selection of designs. Most of them have illustrations or icons that will boost your visuals!
This time, we’ve designed some infographics with illustrations of buildings. How about you use their varied heights to your advantage and visually explain some numeric data? Apart from this, there are also some timelines, maps and even donut charts, among others, that you can use to show a process or...
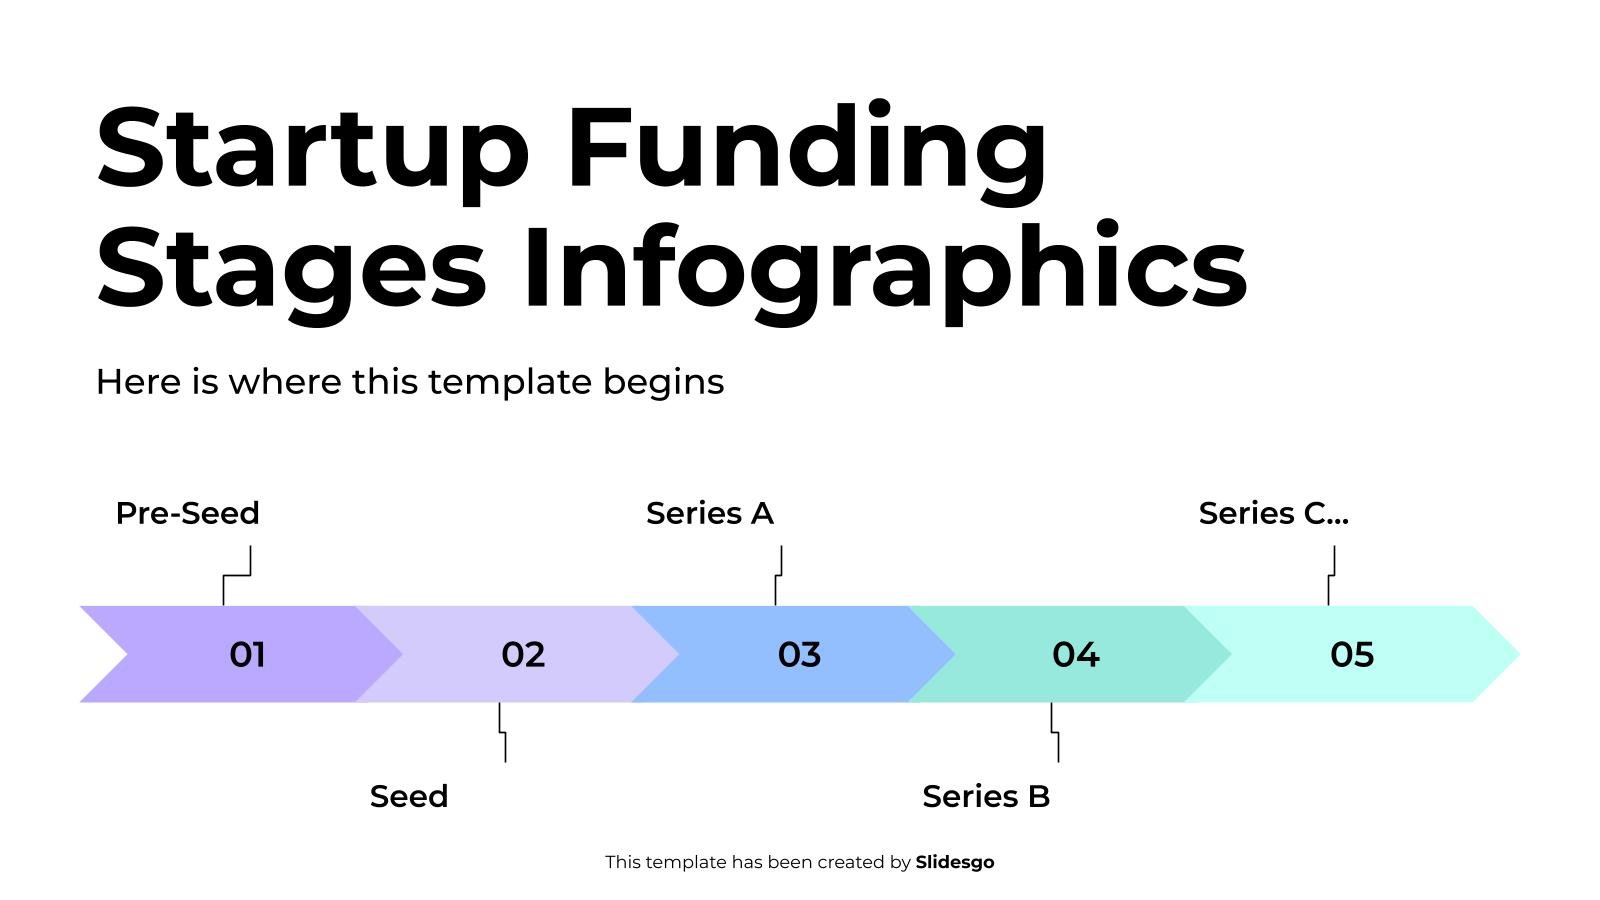
Download the Startup Funding Stages Infographics template for PowerPoint or Google Slides to get the most out of infographics. Whether you want to organize your business budget in a table or schematically analyze your sales over the past year, this set of infographic resources will be of great help. Start...
Join Slidesgo in this new release: a set of infographics about gaming. All of our colorful designs revolve around gamers, gamepads, directional buttons, lifebars and consoles. Is your pitch about technology or e-sports? You won’t go wrong then! Most of the shapes are circles, squares or rectangles, and everything is...
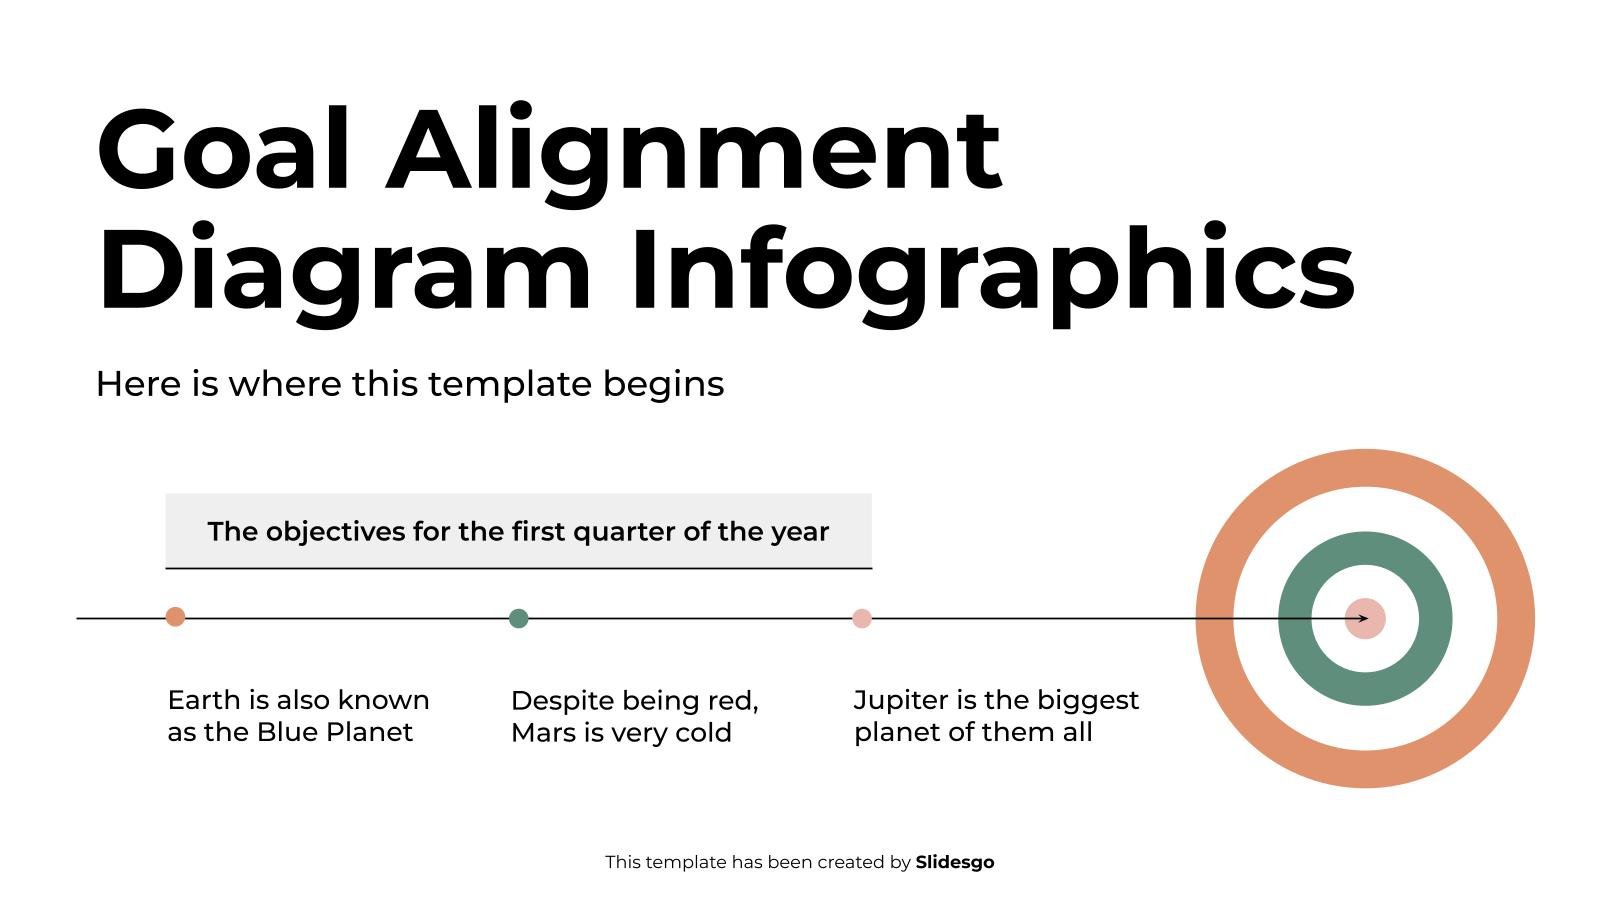
Download the Goal Alignment Diagram Infographics template for PowerPoint or Google Slides to get the most out of infographics. Whether you want to organize your business budget in a table or schematically analyze your sales over the past year, this set of infographic resources will be of great help. Start...
Do you own a bar or restaurant? Do you work in the food industry? We have good news! These flat infographics depict several types of drinks displaying price tables, bar and pie charts, steps, blocks, products and maps. Add any sort of information and edit them as needed.
Are you an expert knitter? Why don't you take advantage of it and share your knowledge with others? With this Slidesgo template we make it easy for you. It includes a multitude of infographics that will help you explain the step by step of the knitting patterns. We have also...
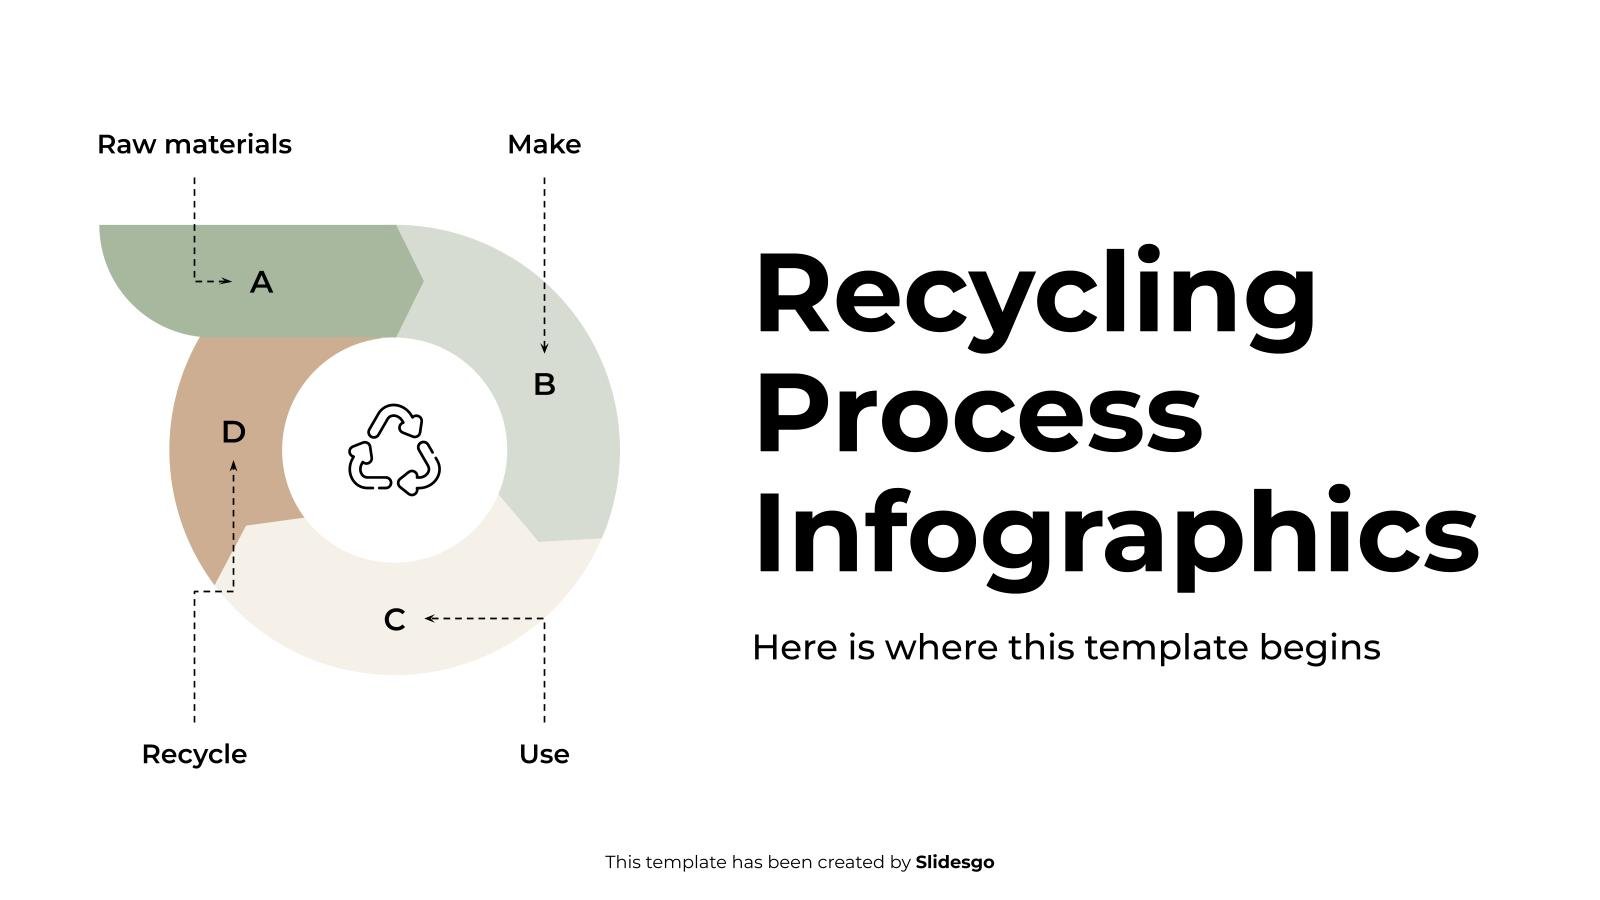
Download the Recycling Process Infographics template for PowerPoint or Google Slides and discover this set of editable infographics for education presentations. These resources, from graphs to tables, can be combined with other presentations or used independently. The most important thing is what you will achieve: transmit information in an orderly...
There are several religions in the world, and this being an important topic for many people, it's natural we had to create infographics that help you highlight data on this matter. We offer you some diagrams, percentages, bars, maps, timelines and other resources. Everything is totally editable, and the slides...
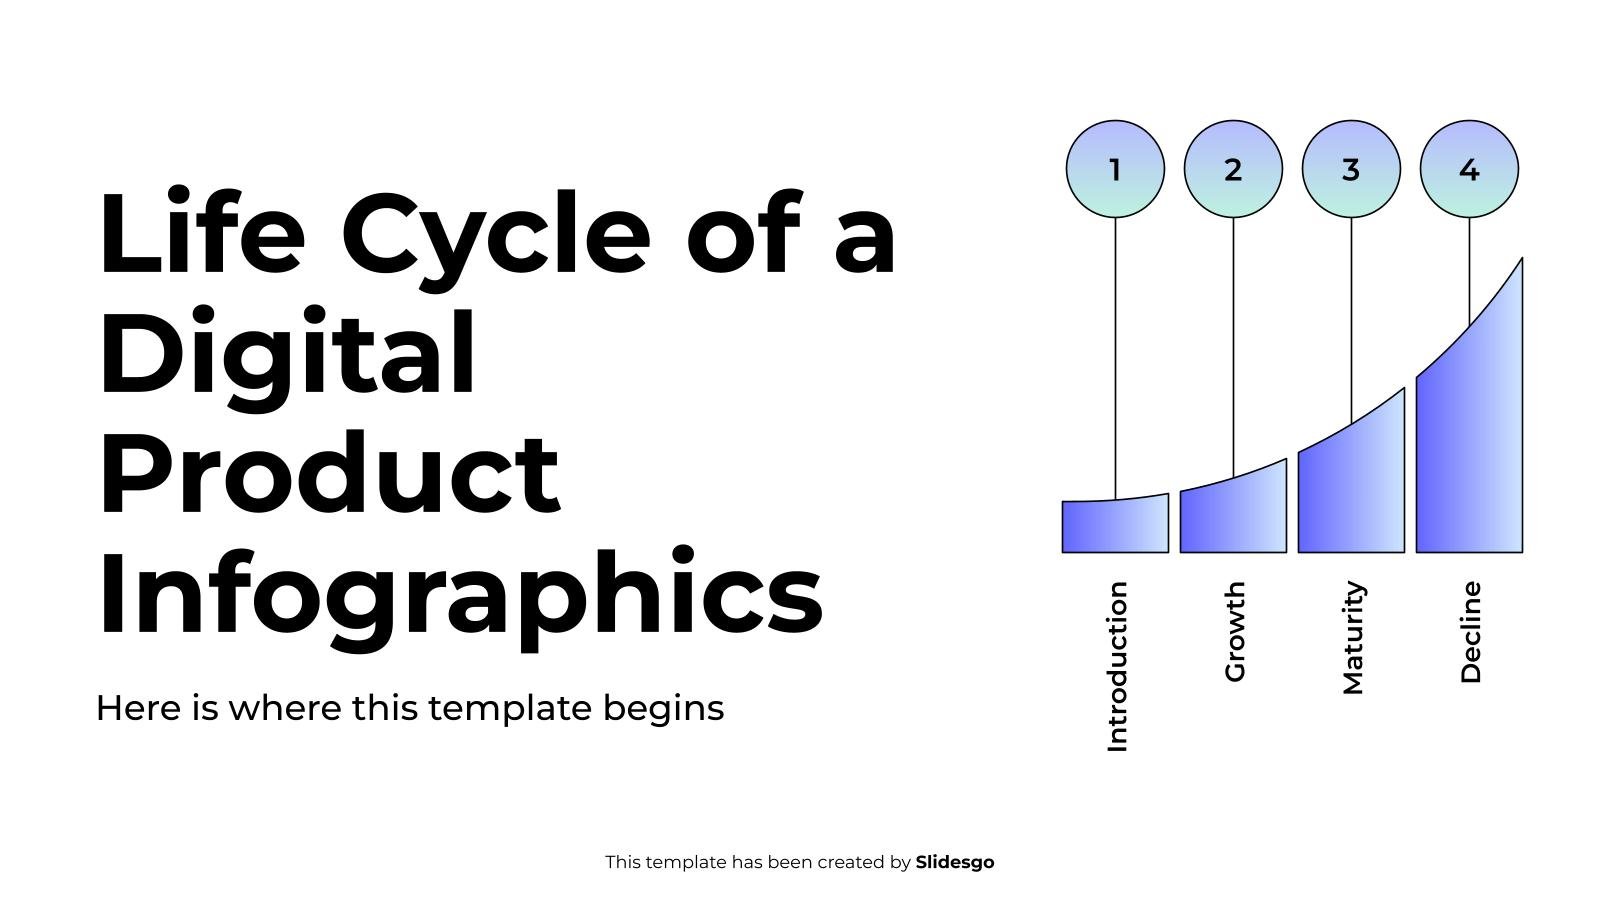
Download the Life Cycle of a Digital Product Infographics template for PowerPoint or Google Slides to get the most out of infographics. Whether you want to organize your business budget in a table or schematically analyze your sales over the past year, this set of infographic resources will be of...
There's no doubt about it: blackboards are one of the most iconic objects that you can find in a classroom. Power up your educational presentations by inserting these infographics into your slides. A hand-written font. several colors and many doodles make up the designs, along with the graphs and other...
According to color psychology, different colors can convey different meanings, which is especially relevant in fields such as art, architecture, fashion or advertising. It's no surprise we had to design a set of editable infographics on this subject! These graphs, tables, schemes, diagrams and more are a great helping hand...
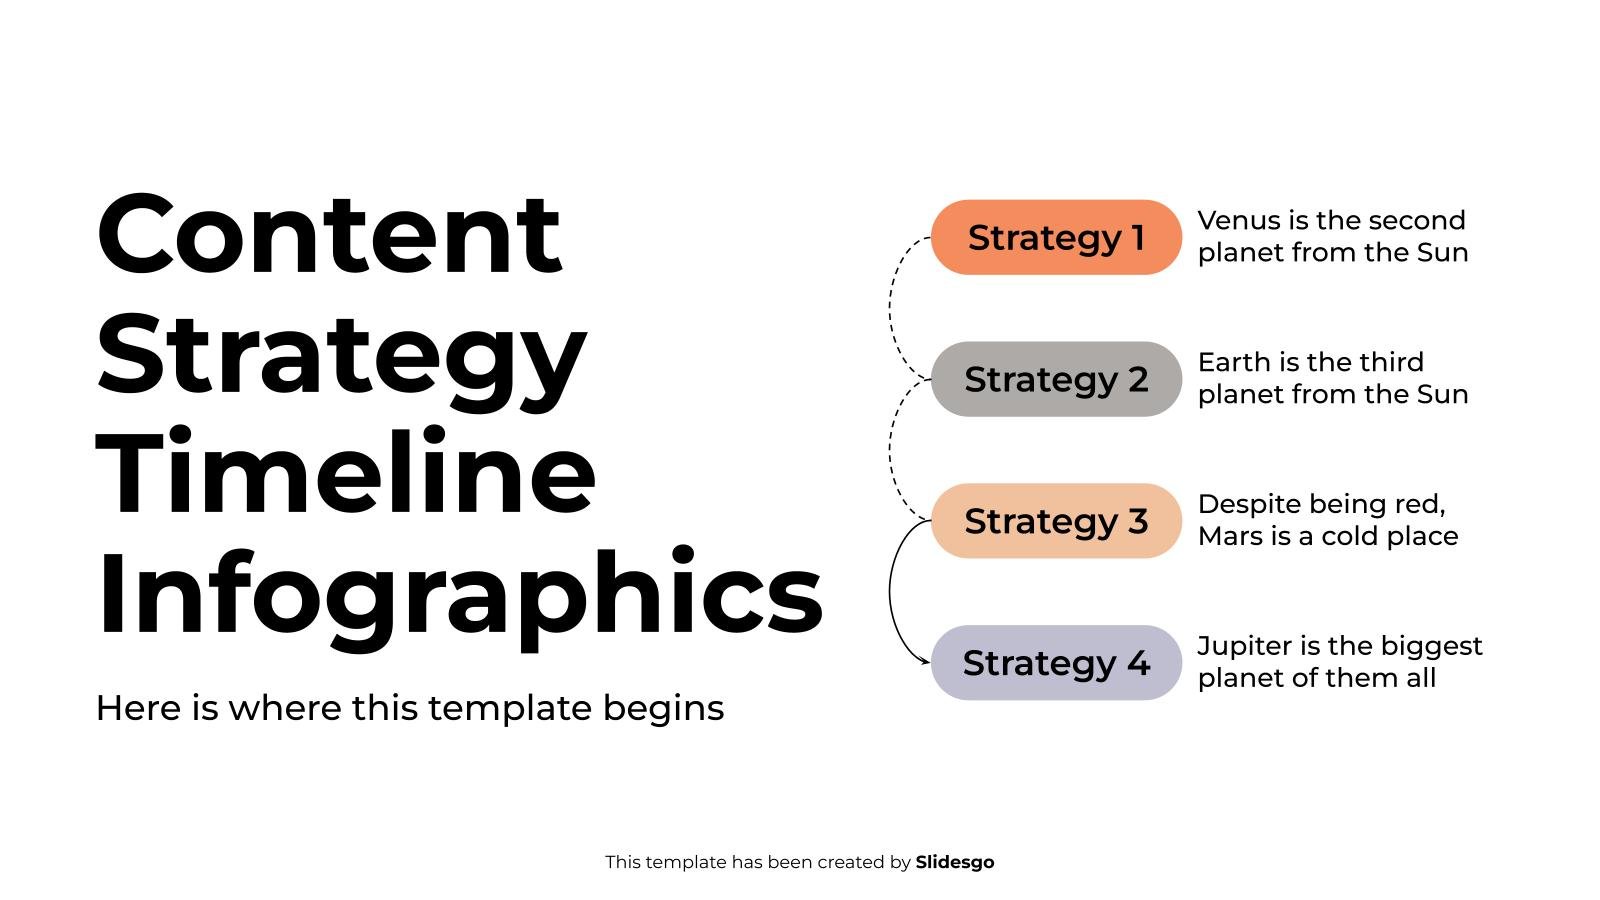
Download the Content Strategy Timeline Infographics template for PowerPoint or Google Slides to get the most out of infographics. Whether you want to organize your business budget in a table or schematically analyze your sales over the past year, this set of infographic resources will be of great help. Start...
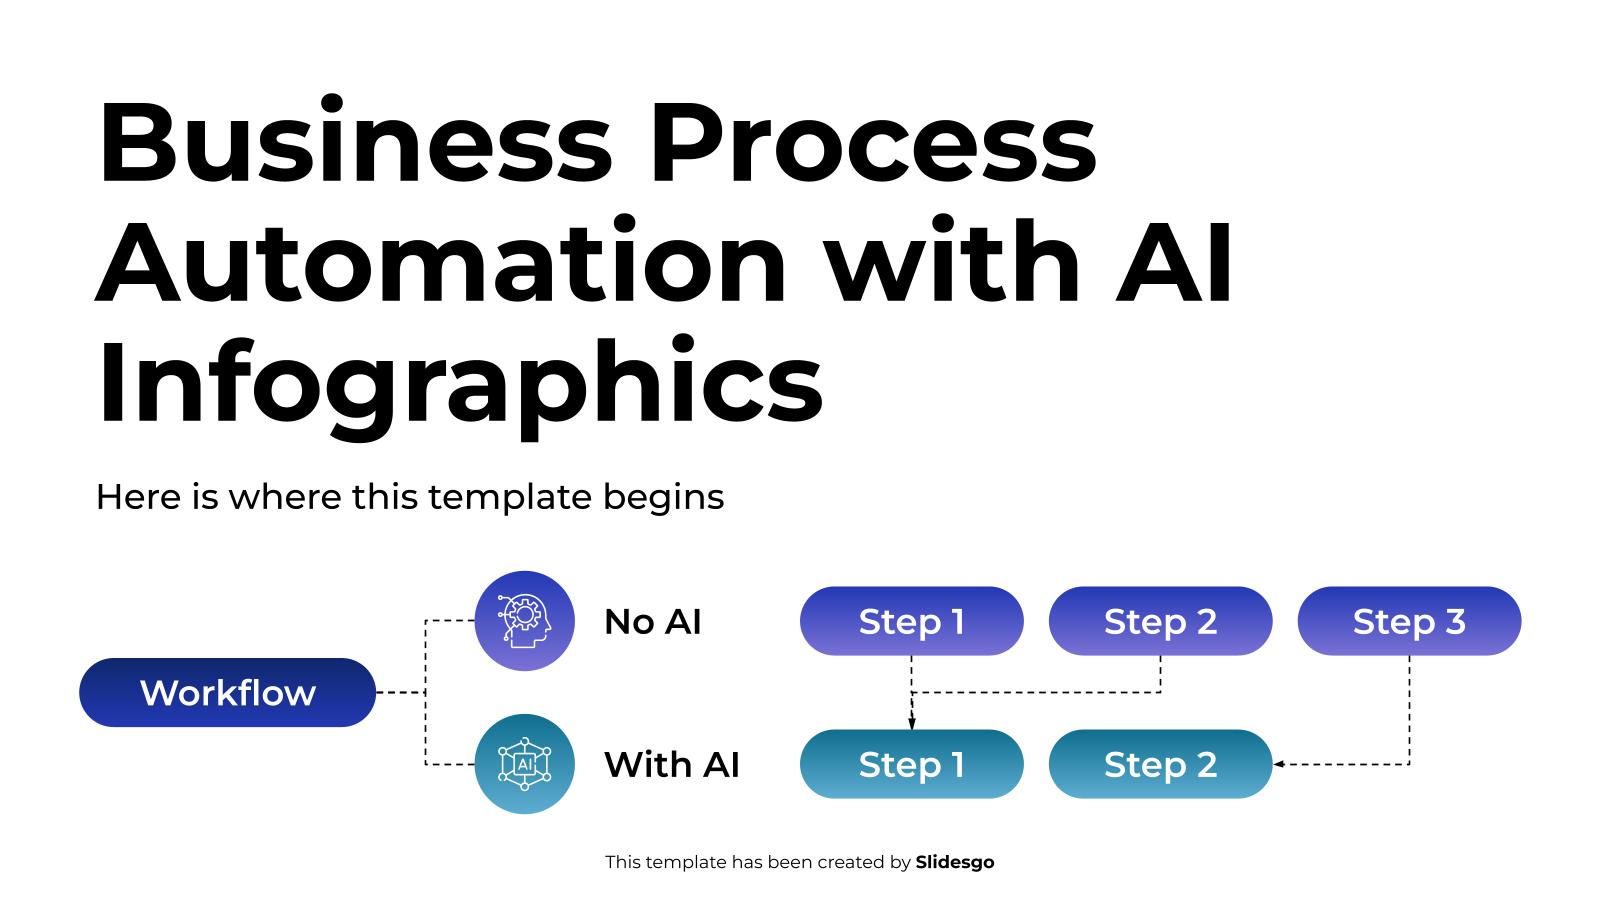
Download the Business Process Automation with AI Infographics template for PowerPoint or Google Slides to get the most out of infographics. Whether you want to organize your business budget in a table or schematically analyze your sales over the past year, this set of infographic resources will be of great...
There is a lot of disinformation about menstruation. Why don’t you use this set of infographics to illustrate this complicated process? The slides are full or illustrative representations of the female organs, maps, charts and resources that will make speaking about it way easier. They have been designed in pastel...
Have you ever thought about where rain comes from? It’s the evaporated water from the seas and the earth, it rises into the atmosphere because it’s hot and hot steam flies upwards. When it reaches a point in which it gets cold, the stem condenses and falls because now it’s...
