Infographics Presentation templates - Page 7
Discover our engaging Google Slides and PowerPoint slides full of infographics to present your information or data clearly and quickly!


It seems that you like this template!

Register for free and start downloading now
Download the PMO: Long Term Level Planning Infographics template for PowerPoint or Google Slides to get the most out of infographics. Whether you want to organize your business budget in a table or schematically analyze your sales over the past year, this set of infographic resources will be of great...

Download the Strategic Plan Roadmap Infographics template for PowerPoint or Google Slides to get the most out of infographics. Whether you want to organize your business budget in a table or schematically analyze your sales over the past year, this set of infographic resources will be of great help. Start...

Do you have a presentation that includes a slide to specifically talk about the methodology? Use these infographics to power up the visuals of your deck and help the audience visualize the data. Roadmaps, timelines, processes, steps; the choice is yours! We’ve also included some linear icons that could come...

Download the PMO: Long Term Level Planning Infographics template for PowerPoint or Google Slides and discover the power of infographics. An infographic resource gives you the ability to showcase your content in a more visual way, which will make it easier for your audience to understand your topic. Slidesgo infographics...

Download the Last Week of School Infographics template for PowerPoint or Google Slides and discover this set of editable infographics for education presentations. These resources, from graphs to tables, can be combined with other presentations or used independently. The most important thing is what you will achieve: transmit information in...

Representing information in a circular way can be a little bit difficult! The different points you want to show are somewhat connected to each other and they don’t follow any particular order, or rather they present a process that repeats. If you need to represent the principal components of a...
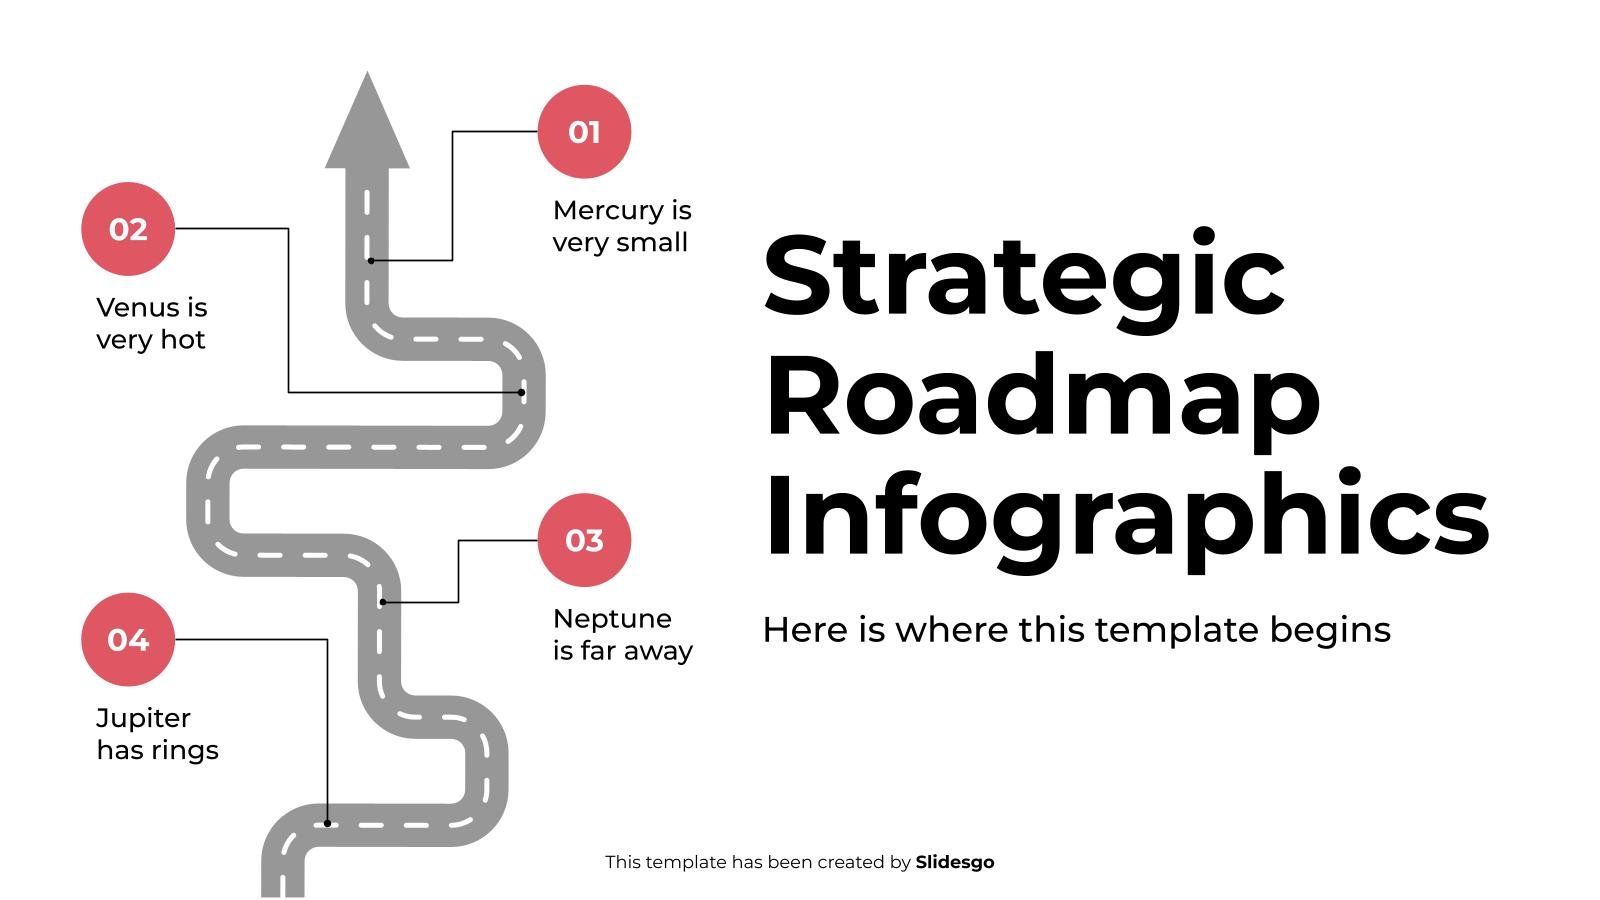
Download the Strategic Roadmap Infographics template for PowerPoint or Google Slides to get the most out of infographics. Whether you want to organize your business budget in a table or schematically analyze your sales over the past year, this set of infographic resources will be of great help. Start using...
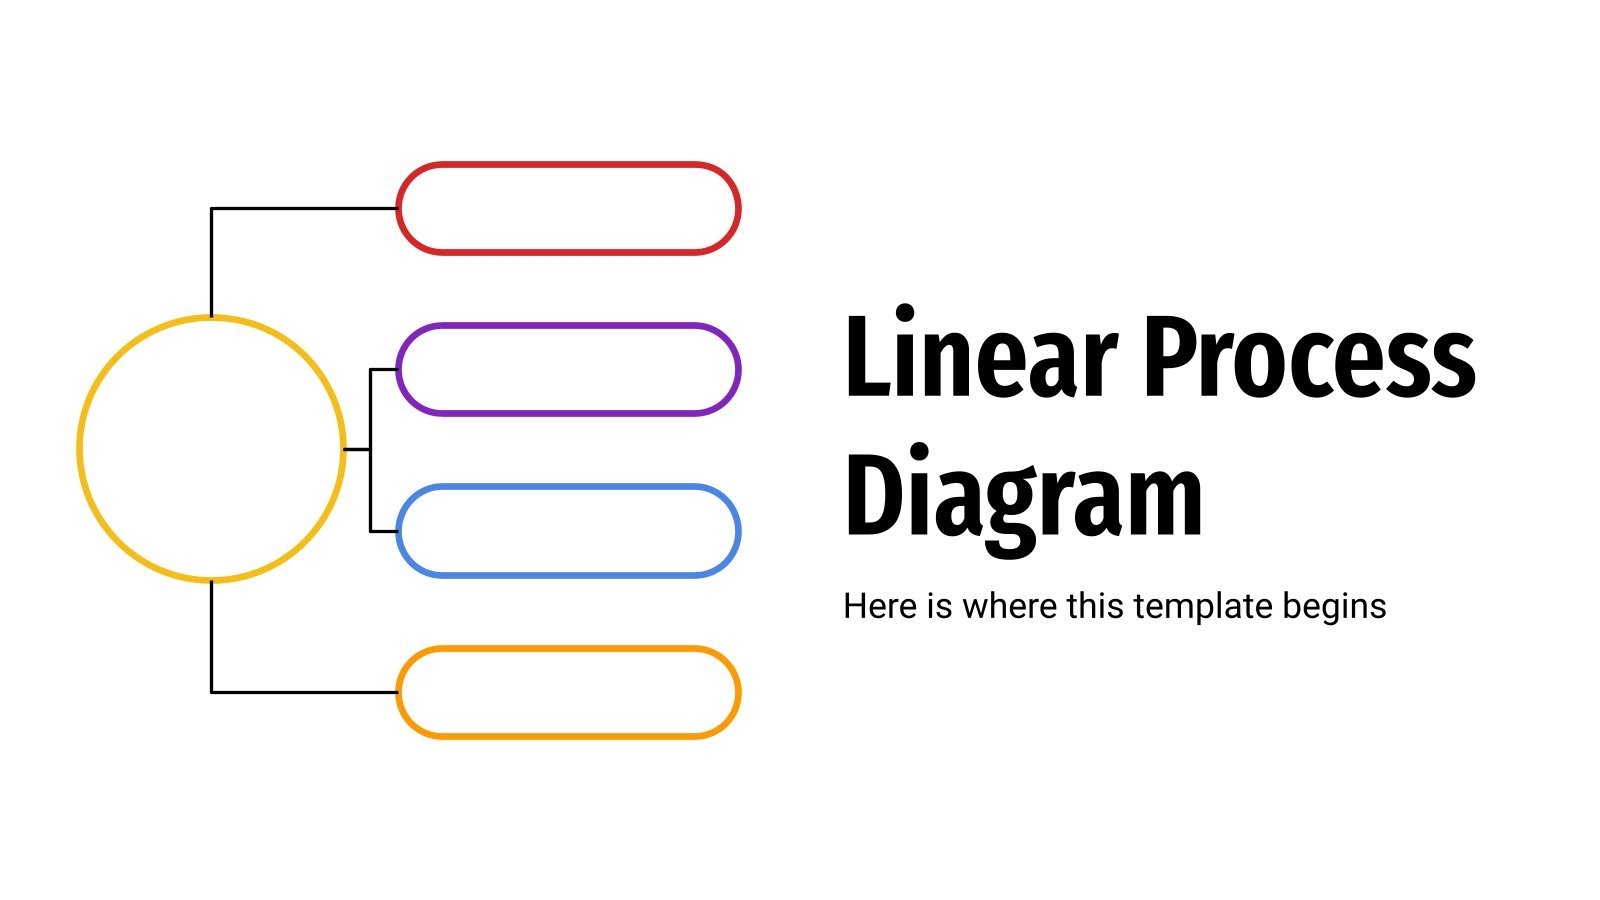
To illustrate data in the most visual way sometimes we need something simple and effective that just does the job. Nothing fancy or confusing, but something clear and to the point. This is why this set of diagrams exist! Its purpose is to help you with linking your information in...

Download the "Cycle Diagrams Theme for a Case Report" presentation for PowerPoint or Google Slides. A clinical case is more than just a set of symptoms and a diagnosis. It is a unique story of a patient, their experiences, and their journey towards healing. Each case is an opportunity for...

Download the Chart Infographics template for PowerPoint or Google Slides to get the most out of infographics. Whether you want to organize your business budget in a table or schematically analyze your sales over the past year, this set of infographic resources will be of great help. Start using infographics...

Download the Simple Quadrants Infographics template for PowerPoint or Google Slides to get the most out of infographics. Whether you want to organize your business budget in a table or schematically analyze your sales over the past year, this set of infographic resources will be of great help. Start using...

Download the Customer Journey Infographics template for PowerPoint or Google Slides to get the most out of infographics. Whether you want to organize your business budget in a table or schematically analyze your sales over the past year, this set of infographic resources will be of great help. Start using...

Download the Comparative Tables Theme presentation for PowerPoint or Google Slides and start impressing your audience with a creative and original design. Slidesgo templates like this one here offer the possibility to convey a concept, idea or topic in a clear, concise and visual way, by using different graphic resources....

Tables, the unsung hero of infographics. They say a picture is worth a thousand words, but a well-designed table can convey even more information in the blink of an eye. And with editable templates like this one for Google Slides and PowerPoint, the creative possibilities are endless. Tables don't have...
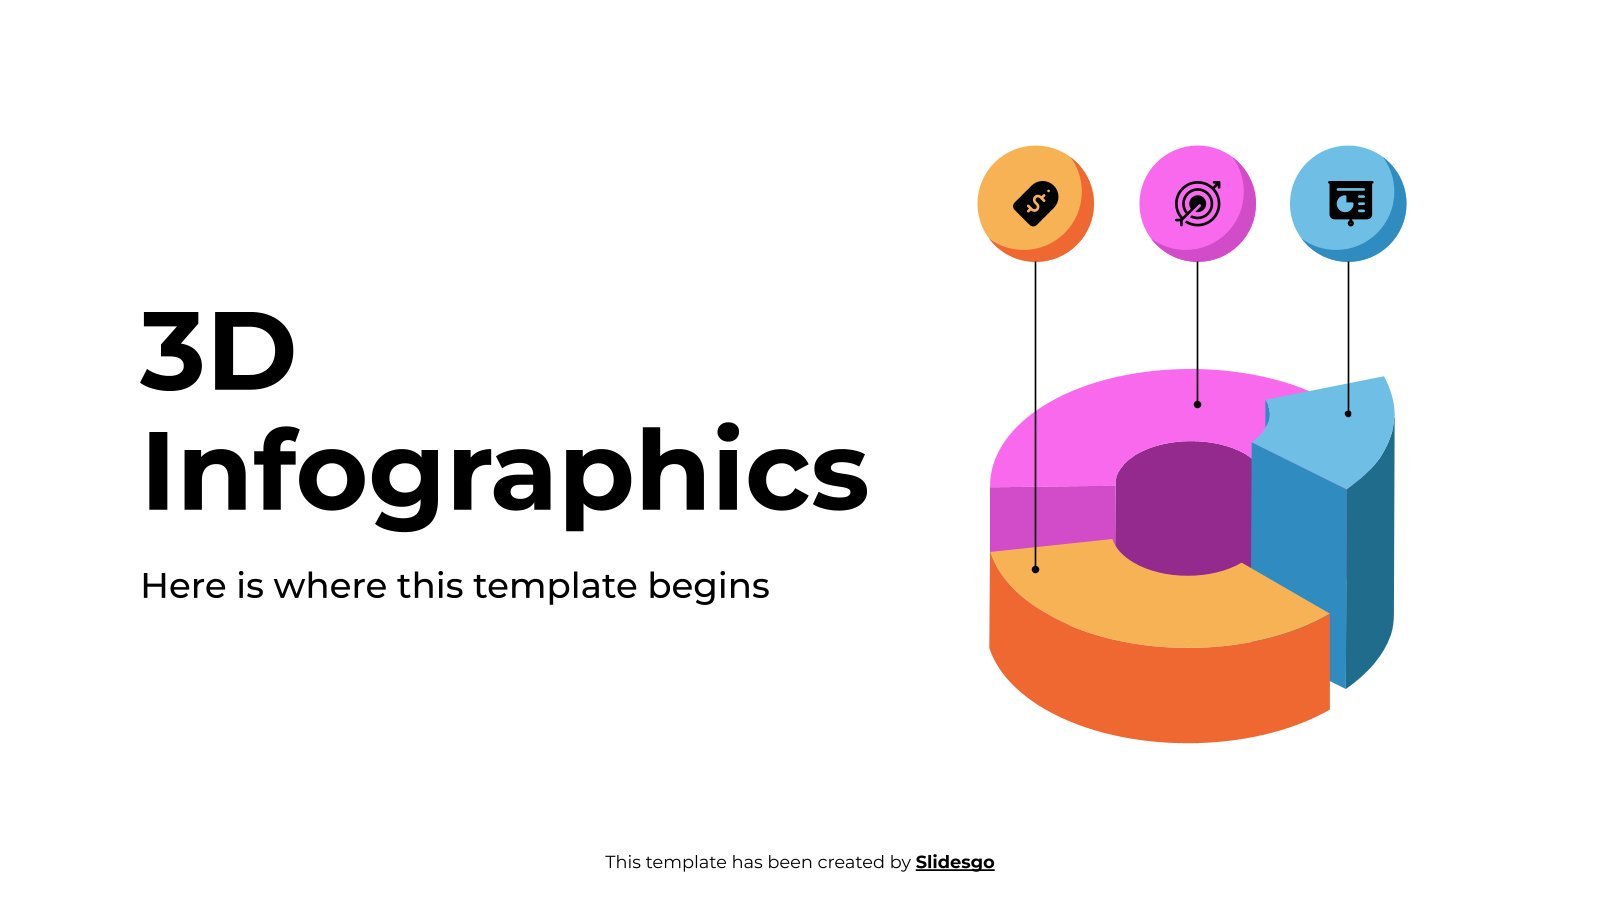
Download the "3D Infographics" template for PowerPoint or Google Slides and discover the power of infographics. An infographic resource gives you the ability to showcase your content in a more visual way, which will make it easier for your audience to understand your topic. Slidesgo infographics like this set here...
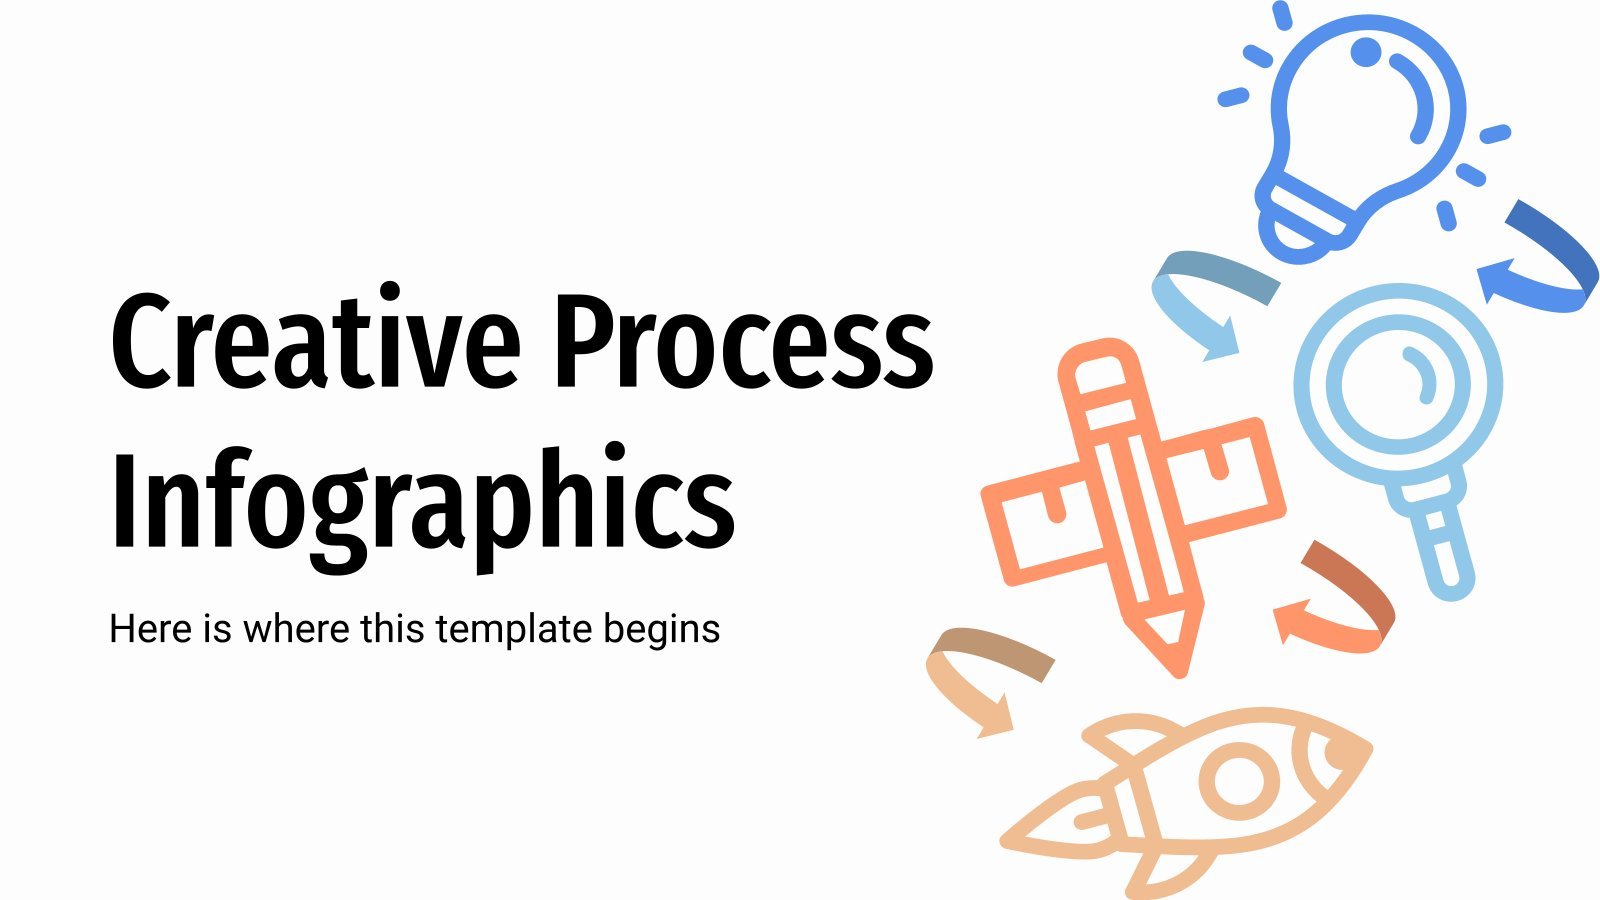
How do people go from an idea to its final realization? Well, there are many ways, but we can define that as a creative process that goes from ideation to research, design, development and, finally, launch. These infographics are perfect for representing these steps, and the variety of designs will...

Download the Effective Mind Maps Infographics template for PowerPoint or Google Slides to get the most out of infographics. Whether you want to organize your business budget in a table or schematically analyze your sales over the past year, this set of infographic resources will be of great help. Start...

Ready to use funnel infographics? They are perfect for business and marketing. Thanks to their conical shapes, you can depict the different steps to achieve your goal (e.g. a given client or lead.) Each section represents a percentage of loss for each stage of the process, that’s why they are...