Infographics Presentation templates - Page 69
Discover our engaging Google Slides and PowerPoint slides full of infographics to present your information or data clearly and quickly!


It seems that you like this template!

Register for free and start downloading now
These slides are meant to help you spread awareness about mental health and its importance. All our infographics revolve around this concept, and thus include on-topic resources. Edit the bar graphs, pie charts, percentages, timelines and circular diagrams with your data. You could even combine this with our Mental Health...

Download the A/B Testing Infographics template for PowerPoint or Google Slides to get the most out of infographics. Whether you want to organize your business budget in a table or schematically analyze your sales over the past year, this set of infographic resources will be of great help. Start using...
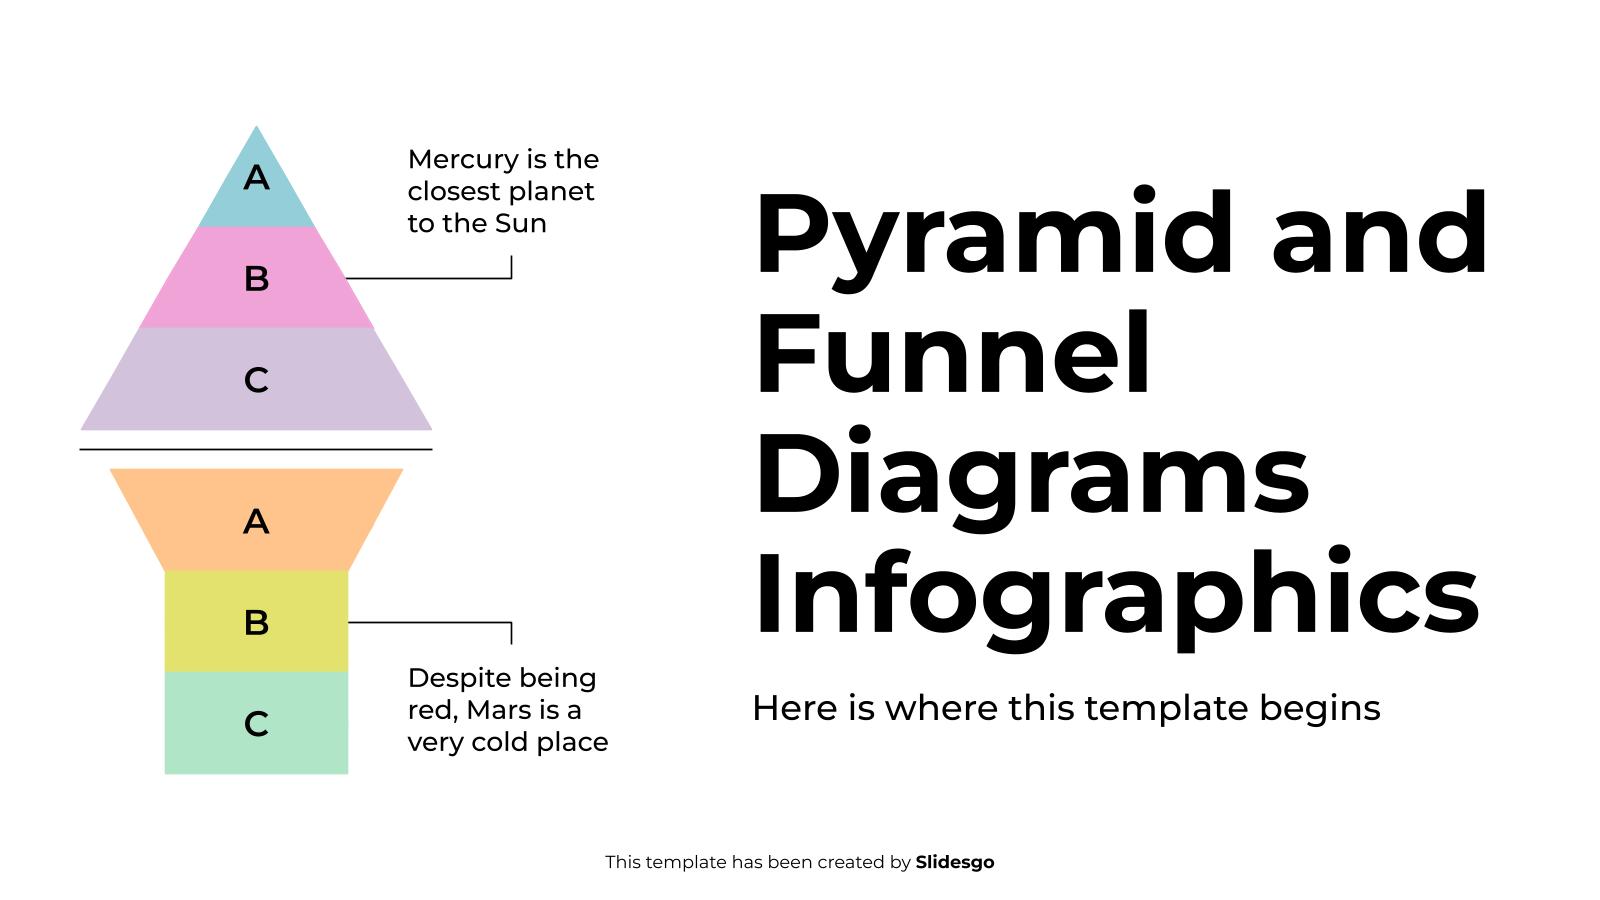
Download the Pyramid and Funnel Diagrams Infographics template for PowerPoint or Google Slides to get the most out of infographics. Whether you want to organize your business budget in a table or schematically analyze your sales over the past year, this set of infographic resources will be of great help....

Download the Linear Infographics template for PowerPoint or Google Slides to get the most out of infographics. Whether you want to organize your business budget in a table or schematically analyze your sales over the past year, this set of infographic resources will be of great help. Start using infographics...

Do you want to give a report on how the market is faring and how it is segmented? Edit these infographics with your market share data, make comparisons, highlight your main competitors and so on. We’ve got circle charts, maps, bar graphs and tons of percentages.

Our new infographics contain maps of Taiwan, so you can edit them to your liking and talk about geography, demographics, climate or other data concerning this island in Asia. The graphic style is mostly flat, with a couple of doodle-styled slides added into the mix.

Let’s travel to the southern hemisphere, to Australia! Our infographics are based on maps of this country, so you can use them to talk about geography, demographics, climatology, regions, anything you can come up with about this country. The designs are flat, but there are a couple of isometric ones...

Think about it: you need some infographics, diagrams, charts or timelines for a presentation that is due at the end of October. If you want to surprise everybody (or if your target audience are kids), combine these Halloween designs with your own data. Eye candy for those who love this...

With this new set of infographics, you’ll get lots of different calendars and weekly planners to organize your activities and appointments with ease. You can choose the style that you prefer: fill, flat or hand-drawn. Our designs play around with two colors, so you can use this detail to your...

Download the Smart Goals Infographics template for PowerPoint or Google Slides to get the most out of infographics. Whether you want to organize your business budget in a table or schematically analyze your sales over the past year, this set of infographic resources will be of great help. Start using...

Is your pitch related to nature, sustainability or ecology in any way? Then how about you present some compelling data in a visual manner? Our infographics are a good choice, since all their designs, including maps, timelines and tables, have been created just for these kinds of topics. And the...

What lessons are we having on Tuesday, again? With these new infographics, you will have no problems remembering all your classes and activities. Some of the designs are tables, others are diagrams, others look like lists on pieces of paper. Most of them are color coded to aid you in...

Download the Strategy Wheel Infographics template for PowerPoint or Google Slides to get the most out of infographics. Whether you want to organize your business budget in a table or schematically analyze your sales over the past year, this set of infographic resources will be of great help. Start using...

How’s your balance? Oh, sorry, we’re talking about finance here! Explain all your data on profit, losses, revenue and costs by using these editable infographics. Managing your company’s budget is now easier for all of you, since you can see how much money you’re earning and how much is being...

This set of infographics revolves around one of the most iconic places in the world: New York. Most of the designs incorporate a map of this state, while others are focused more on representative elements. Use these editable slides to explain things about its geography, its culture or its famous...

We have designed this template with a multitude of maps of America to which you can add any information. It contains pie charts, tables, bar charts, location points, lists, icons, demographics infographics, and more. It also has maps by areas, which you can edit with different colours to highlight the...

Download the Communication Infographics template for PowerPoint or Google Slides and discover this set of editable infographics for education presentations. These resources, from graphs to tables, can be combined with other presentations or used independently. The most important thing is what you will achieve: transmit information in an orderly and...

This doodle infographics will help you define your buyer persona or that of your potential client in a very easy way. You can choose from text boxes, balloons, maps, bars and diagrams to describe this semi fictional consumer. We give you different backgrounds and layouts so you can adapt it...