Infographics Presentation templates - Page 20
Discover our engaging Google Slides and PowerPoint slides full of infographics to present your information or data clearly and quickly!


It seems that you like this template!

Register for free and start downloading now
Are you giving a speech on science, perhaps showing some statistics or the results of an experiment? Turn the conference room into a laboratory with these infographics. Represent your data visually by inserting these lab beaker charts into your slides. We have designed them in various styles, ranging from flat...

Download the Employee Benefits Infographics template for PowerPoint or Google Slides and discover the power of infographics. An infographic resource gives you the ability to showcase your content in a more visual way, which will make it easier for your audience to understand your topic. Slidesgo infographics like this set...

If you want to present your information in a very organized way, displaying the different parts of an idea, hexagon infographics allow you to do so! These diagrams don’t show a hierarchical structure, but rather comprehend different sections of concepts.

If you have created a location app or if you want to talk about different places, represent your data in a visual way with these infographics full of maps, paths, pins, bar charts or even roadmaps. Some of them are flat, other present round edges and isometric designs. Its two...

Make your sales strategy understandable and impress everyone with this business template. Use the different infographics to explain the whole process from start to finish. Show all the different elements of the sales procedure and how they interact with each other and indicate the goals and deadlines of your plan.

Download the Dashboard Infographics presentation for PowerPoint or Google Slides and start impressing your audience with a creative and original design. Slidesgo templates like this one here offer the possibility to convey a concept, idea or topic in a clear, concise and visual way, by using different graphic resources. You...
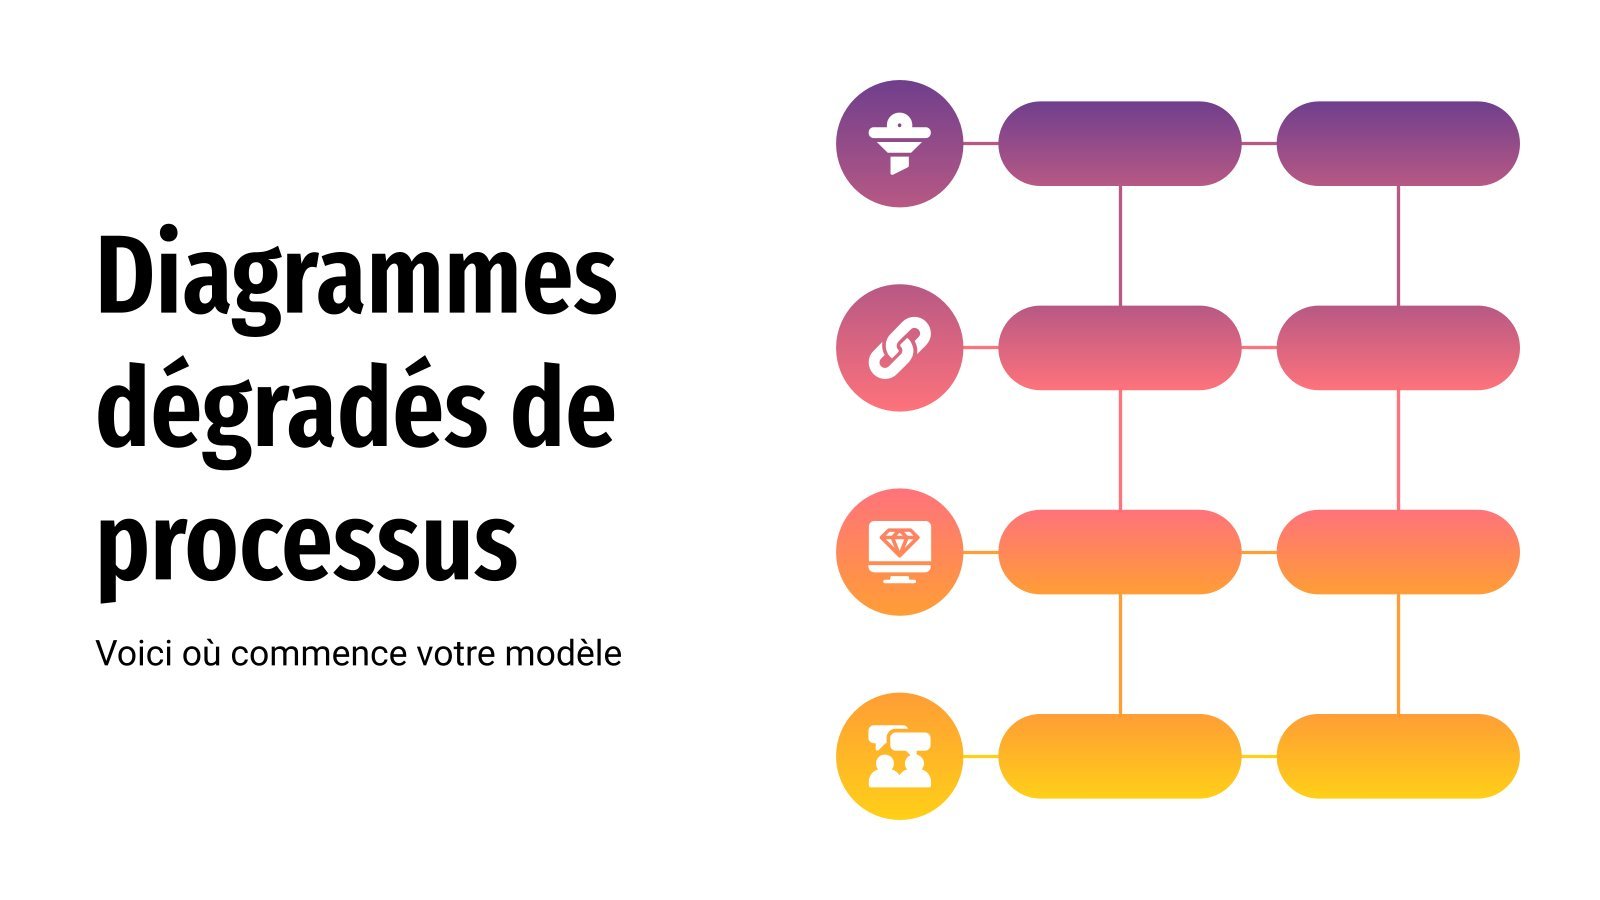
If you need to illustrate the process of a product, the workflows of a company or, in short, any process, we have designed some very special infographics. They are special because the infographic resources have color gradients, which will give an original touch to your content and, in addition, the...

Download the "Military Infographics" template for PowerPoint or Google Slides and discover the power of infographics. An infographic resource gives you the ability to showcase your content in a more visual way, which will make it easier for your audience to understand your topic. Slidesgo infographics like this set here...
We're sure your team will appreciate some kind of visual tracker to see what tasks are already completed and what tasks need to be done. Slidesgo is happy to introduce this set of editable infographics for this exact purpose! You'll find different designs of tables and calendars where you can...

Download the Iceberg Diagram Infographics template for PowerPoint or Google Slides to get the most out of infographics. Whether you want to organize your business budget in a table or schematically analyze your sales over the past year, this set of infographic resources will be of great help. Start using...

Explain your goals and objectives or how to achieve them with these infographics! Tell your audience about what you want to achieve to get new clients, measure your success and encourage your team using these diagrams. Some of them look like mountains, bullseyes, tables, roadmaps, stairs, tables…

Download the School Infographics template for PowerPoint or Google Slides and discover the power of infographics. An infographic resource gives you the ability to showcase your content in a more visual way, which will make it easier for your audience to understand your topic. Slidesgo infographics like this set here...

Download the Flowchart Infographics template for PowerPoint or Google Slides and discover the power of infographics. An infographic resource gives you the ability to showcase your content in a more visual way, which will make it easier for your audience to understand your topic. Slidesgo infographics like this set here...

Download the Funny Infographics template for PowerPoint or Google Slides and discover the power of infographics. An infographic resource gives you the ability to showcase your content in a more visual way, which will make it easier for your audience to understand your topic. Slidesgo infographics like this set here...

A product, an idea, a project—everything has its pros and cons. Now you can convey this information as visually as possible with these infographics. Each slide has a different amount of elements to compare and a varied color palette to better differentiate them. Most of the designs are flat-styled, but...

Did you have a brilliant idea but need help with your presentation? Light bulb infographics have arrived in Slidesgo! Flat, hand-drawn, kawaii, filled and even linear designs are included in this template. All of them are very colorful, so try them and make your pitch shine!
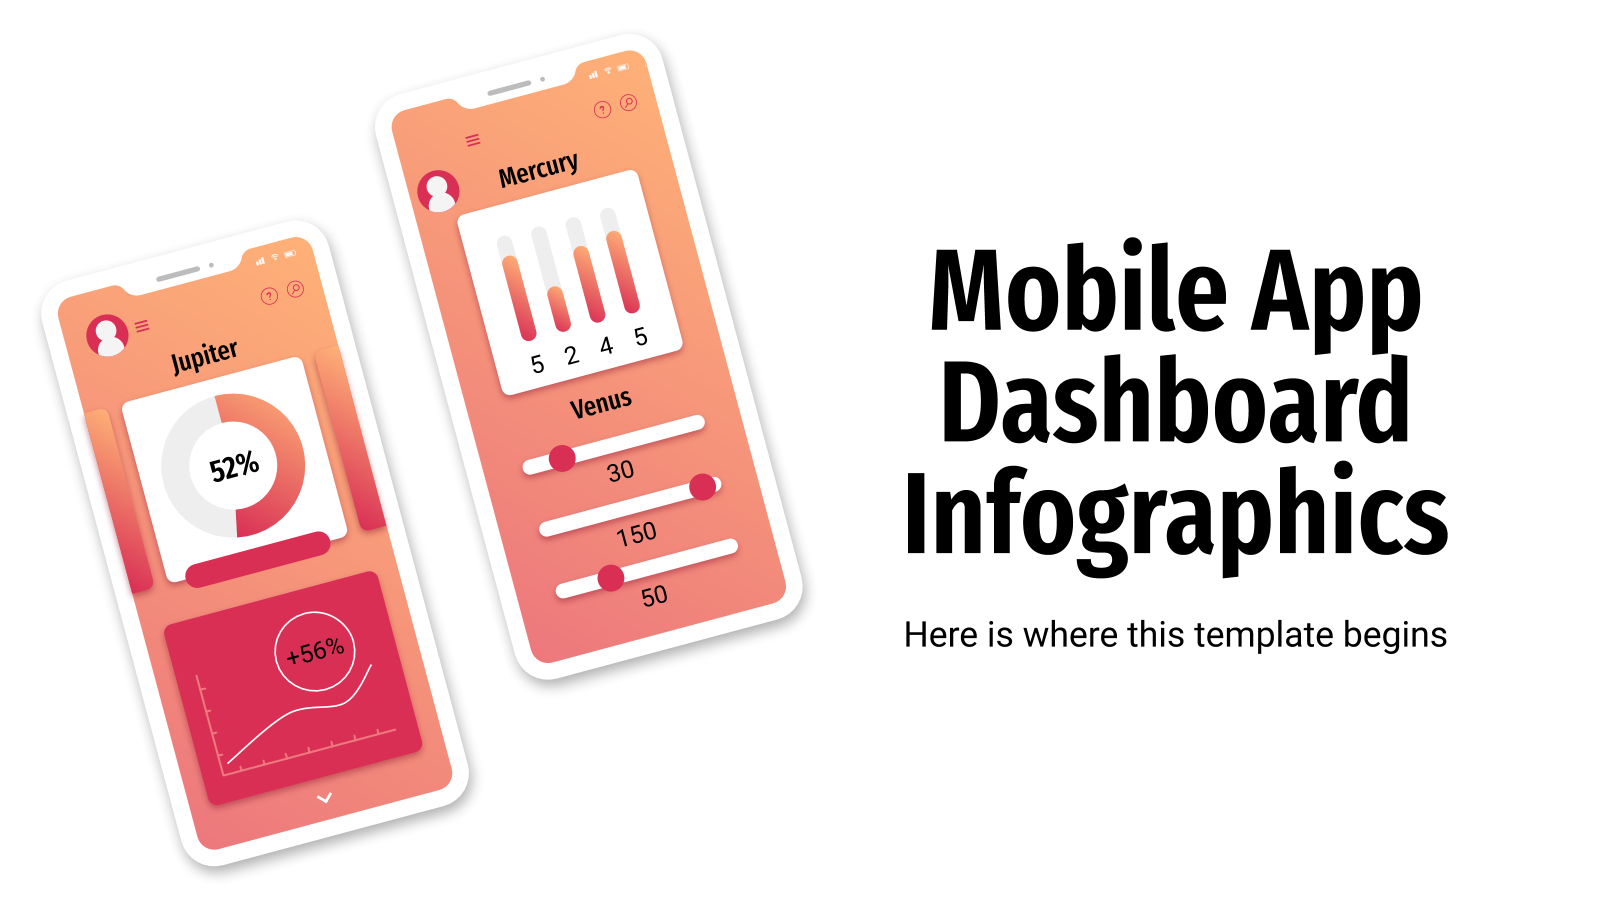
Do you want to be original when presenting information? Infographics are a powerful resource, but how about showing your data like if it were in a mobile app's dashboard? Complete with gauges, icons, gradients and silhouettes of cellphones, these designs will convey visually all the numbers, stats and key performance...

If you feel that bullet points and pictures are not doing justice to your company profile, there’s no better way to highlight your achievements and metrics than by spicing up your presentation using creative and visually appealing infographics! Adding infographics to your company profile can vividly illustrate even the most...