Gradient Infographics Presentation templates
Take your presentations to the next level by inserting our editable infographics for Google Slides and PowerPoint. All of them have colorful gradients!


It seems that you like this template!

Register for free and start downloading now
Do you need some timelines to present the stages of a certain process or project? We have designed many of them. Have a look at the gradients and the different designs: flat, lineal, geometric or hand-drawn. We include 4 to 7 septions per timeline.

Download the Steps Infographics template for PowerPoint or Google Slides to get the most out of infographics. Whether you want to organize your business budget in a table or schematically analyze your sales over the past year, this set of infographic resources will be of great help. Start using infographics...
Download the Project Roadmaps template for PowerPoint or Google Slides to get the most out of infographics. Whether you want to organize your business budget in a table or schematically analyze your sales over the past year, this set of infographic resources will be of great help. Start using infographics...
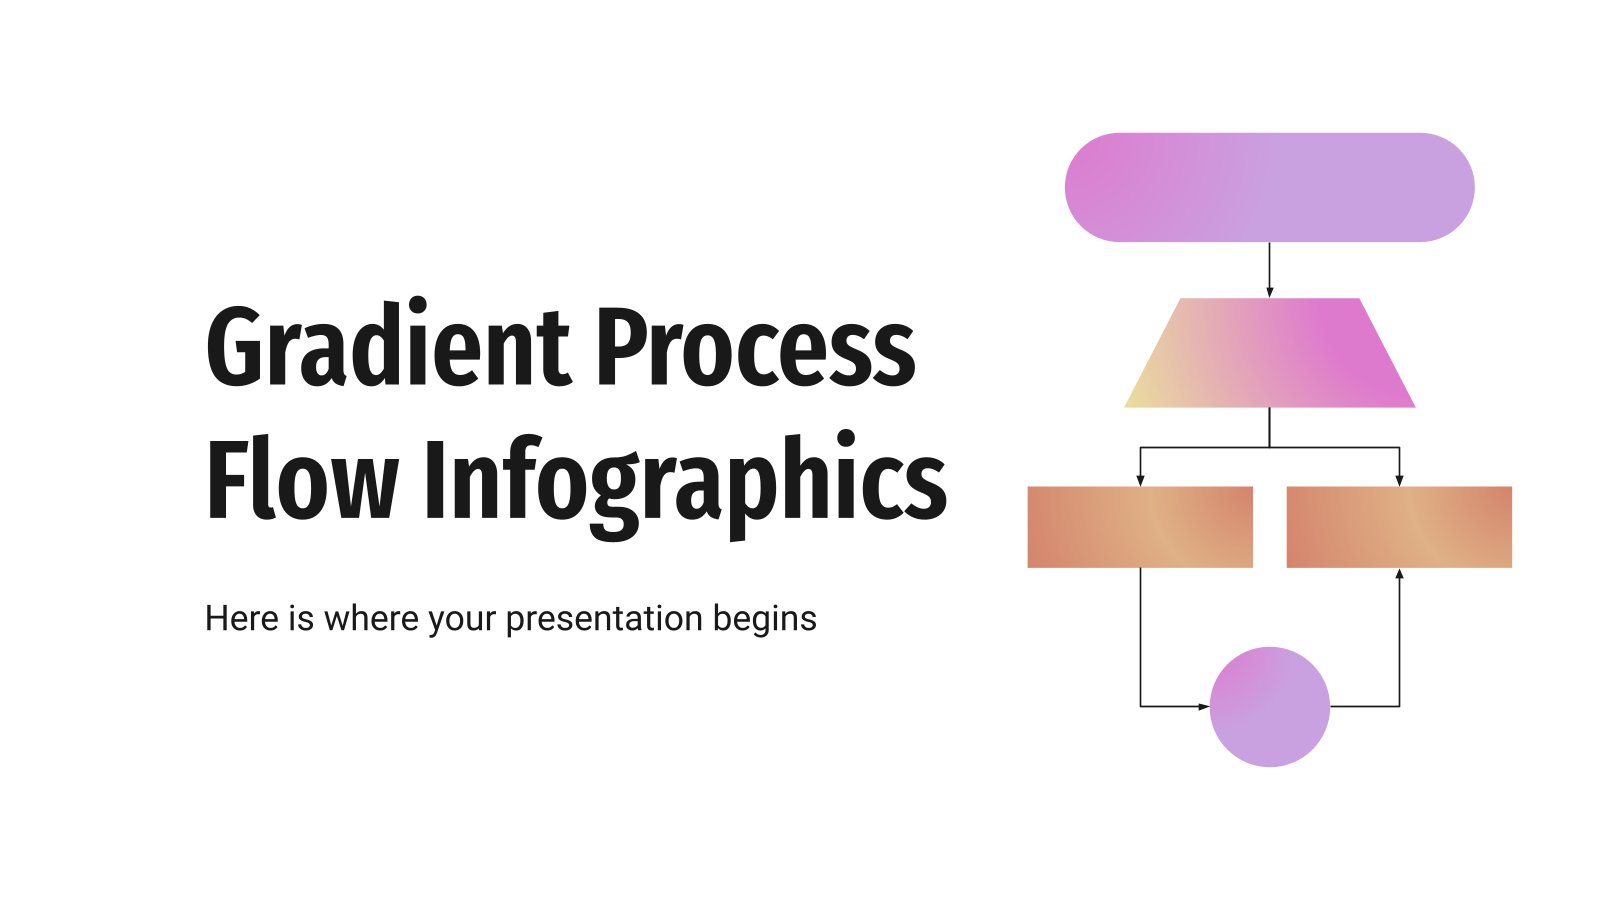
Life is made out of choices, and for every choice you take, more choices open up in front of you! Represent this never-ending process with these infographics with beautiful gradients in purple and orange. Having a clear idea of where your choices get you is key if you don’t want...
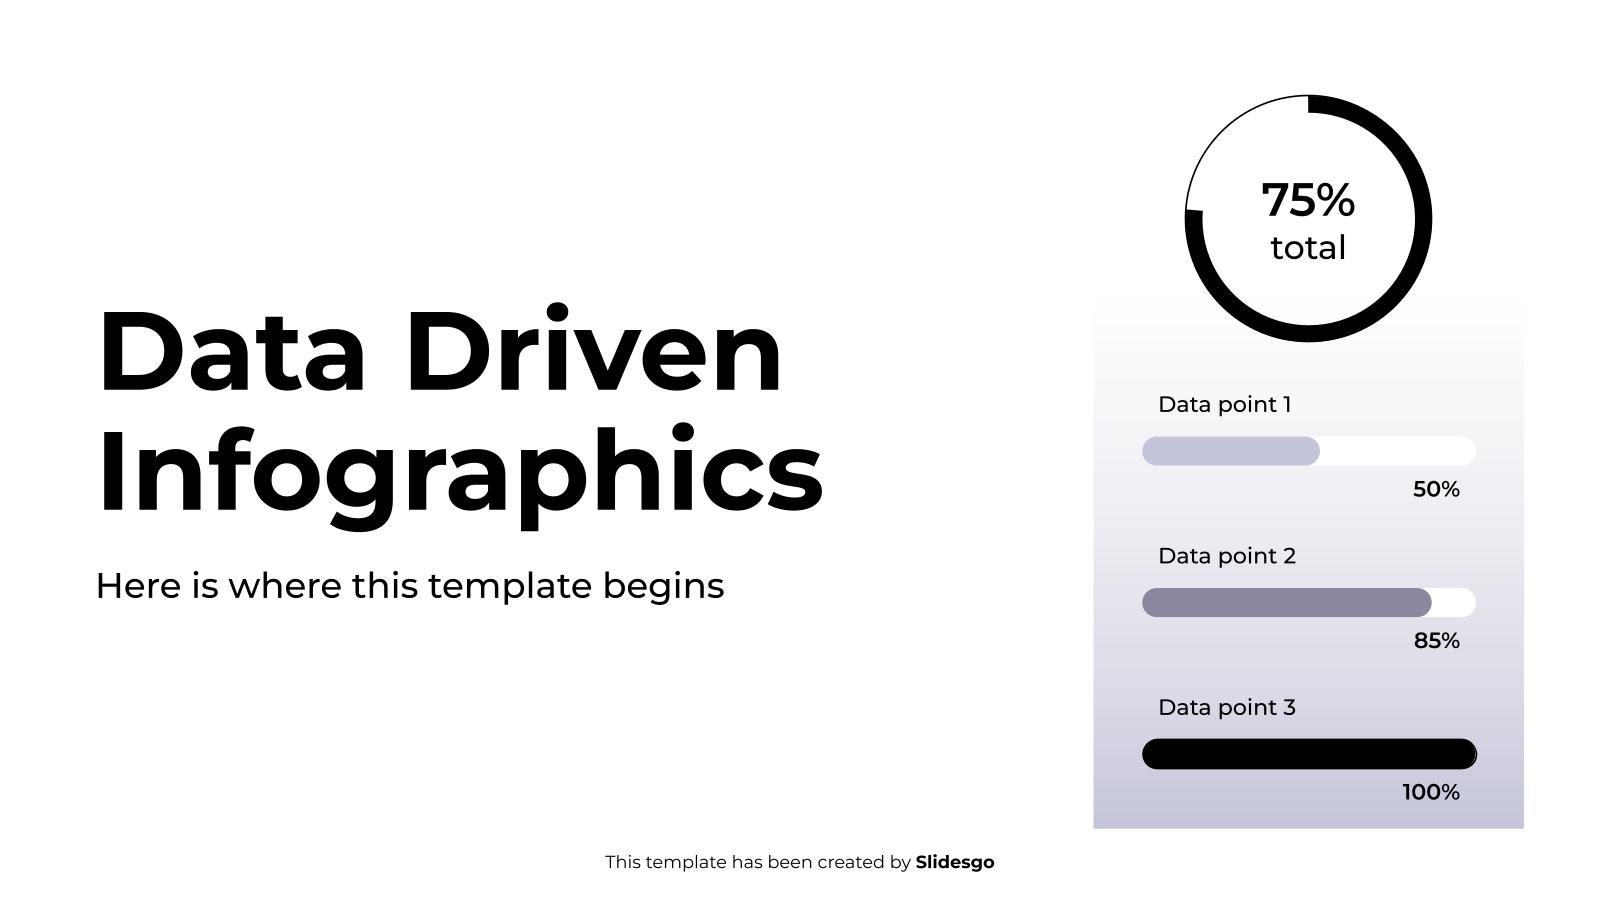
Download the Data Driven Infographics template for PowerPoint or Google Slides to get the most out of infographics. Whether you want to organize your business budget in a table or schematically analyze your sales over the past year, this set of infographic resources will be of great help. Start using...

By now, you'll already know that Mercury is the smallest planet in our solar system and the closest one to the Sun, but perhaps you have other data related to planets or outer space that is more obscure and lesser known. If that is the case, download this set of...
Download the Project Roadmaps template for PowerPoint or Google Slides to get the most out of infographics. Whether you want to organize your business budget in a table or schematically analyze your sales over the past year, this set of infographic resources will be of great help. Start using infographics...

Geometry is nearly a synonym for order, organization, tidyness. Have a look at this set of editable infographics, which have been built with only geometric elements. The variety of designs is huge, ranging from timelines and calendars to mind maps and different types of schemes. Virtually any kind of data...

Download the Construction Project Lifecycle Infographics template for PowerPoint or Google Slides to get the most out of infographics. Whether you want to organize your business budget in a table or schematically analyze your sales over the past year, this set of infographic resources will be of great help. Start...

Download the Checklist Infographics template for PowerPoint or Google Slides and discover the power of infographics. An infographic resource gives you the ability to showcase your content in a more visual way, which will make it easier for your audience to understand your topic. Slidesgo infographics like this set here...

Download the Sales Funnel Growth template for PowerPoint or Google Slides to get the most out of infographics. Whether you want to organize your business budget in a table or schematically analyze your sales over the past year, this set of infographic resources will be of great help. Start using...

Download the Buyer Journey Infographics template for PowerPoint or Google Slides to get the most out of infographics. Whether you want to organize your business budget in a table or schematically analyze your sales over the past year, this set of infographic resources will be of great help. Start using...
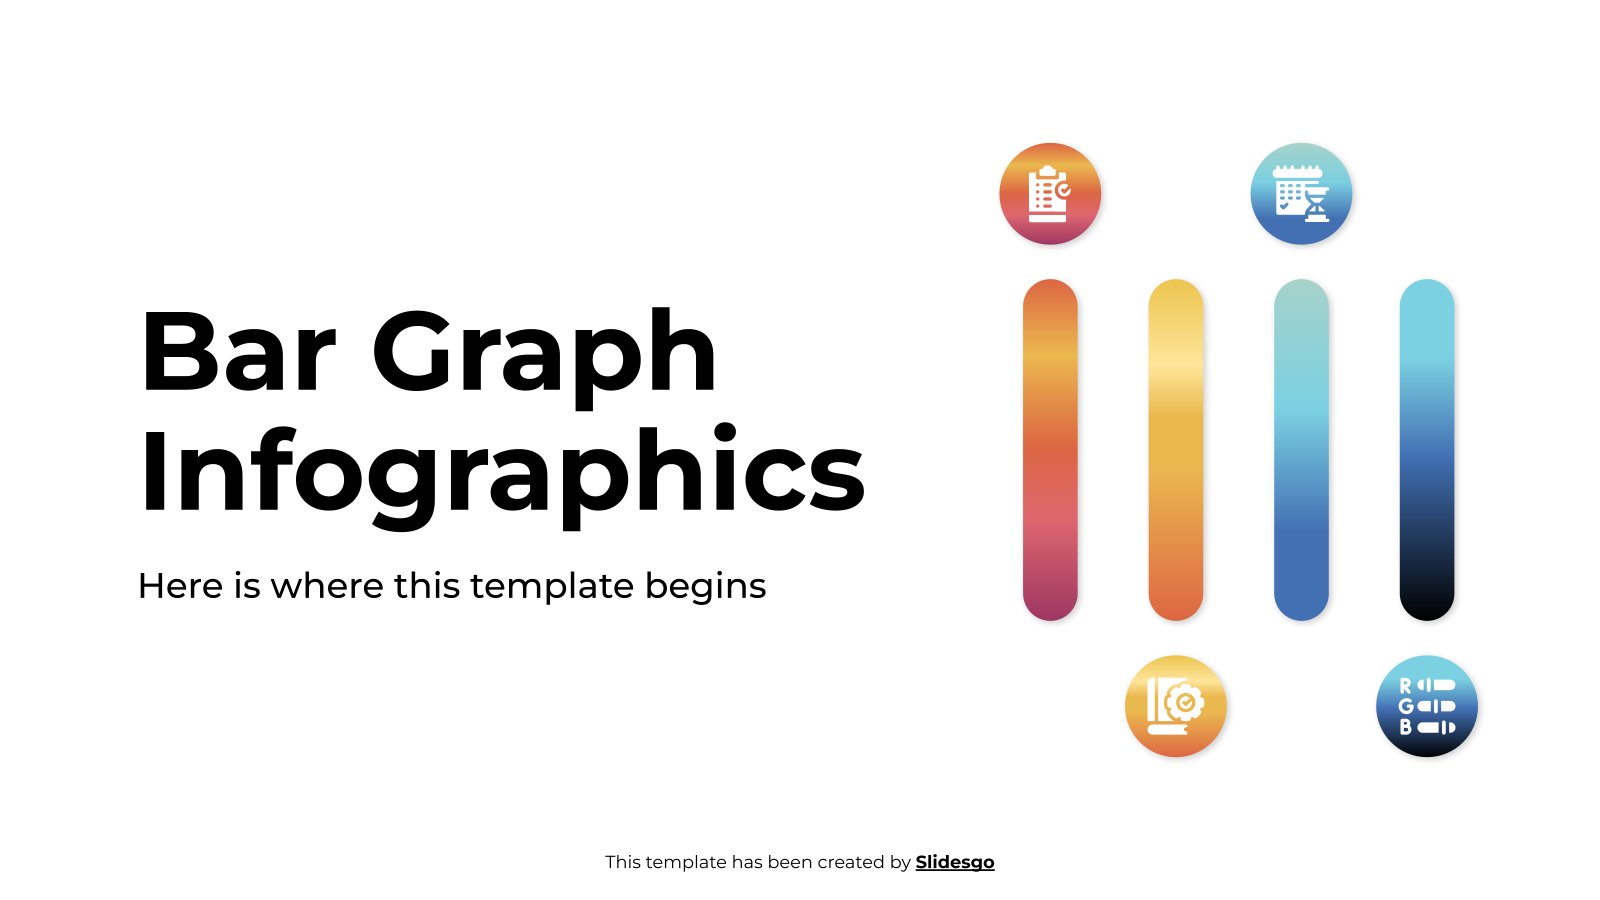
Download the Bar Graph Infographics template for PowerPoint or Google Slides and discover the power of infographics. An infographic resource gives you the ability to showcase your content in a more visual way, which will make it easier for your audience to understand your topic. Slidesgo infographics like this set...
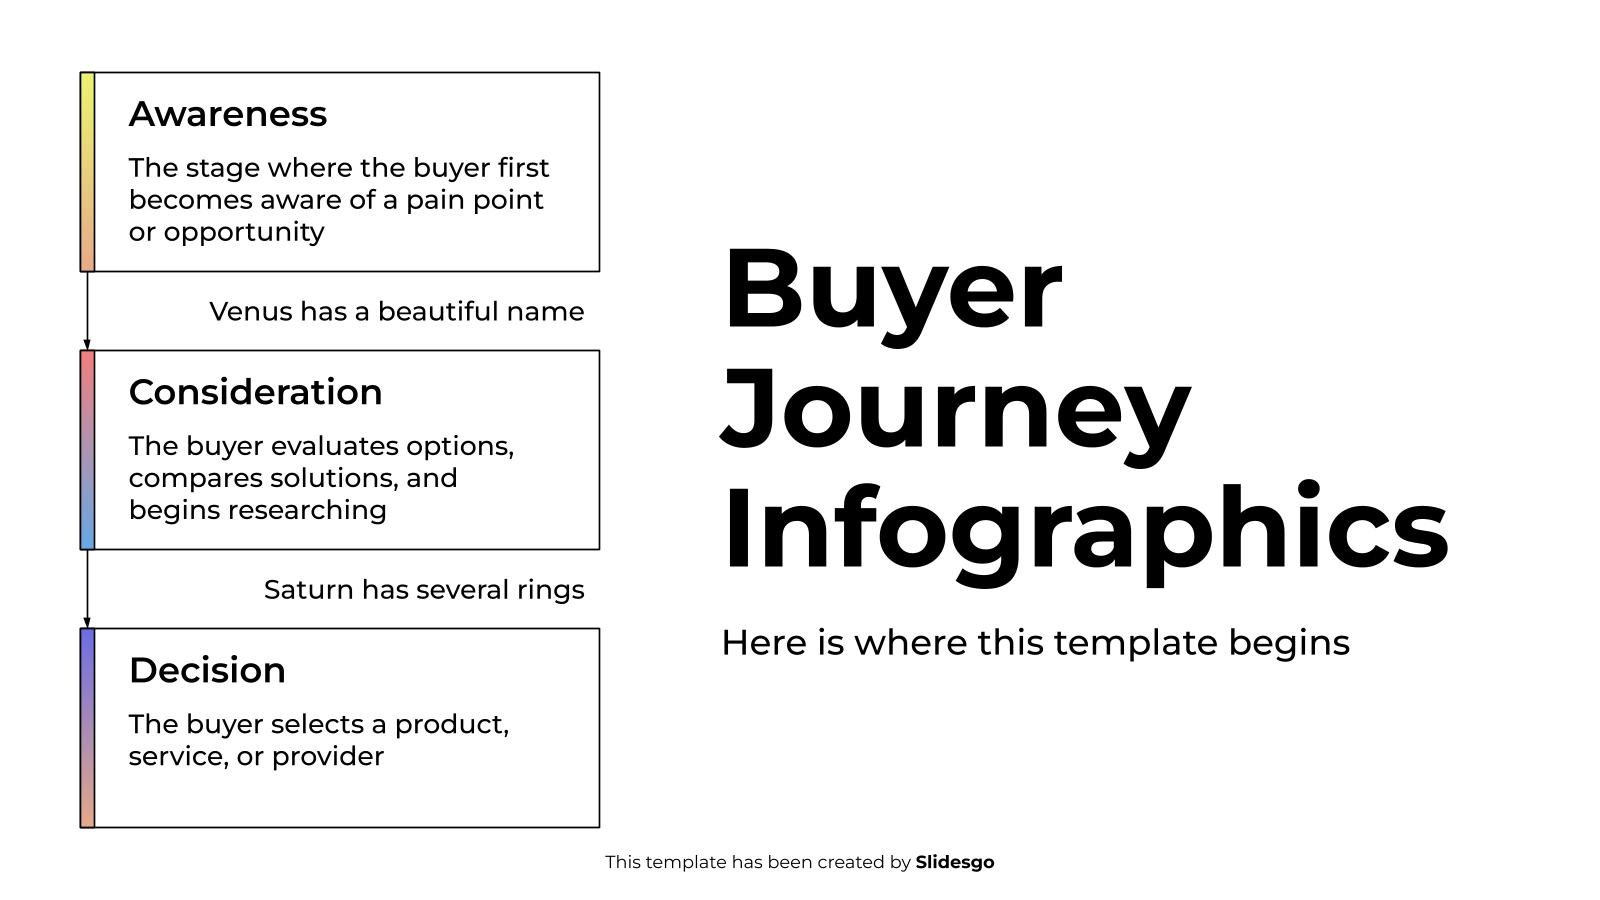
Download the Buyer Journey Infographics template for PowerPoint or Google Slides to get the most out of infographics. Whether you want to organize your business budget in a table or schematically analyze your sales over the past year, this set of infographic resources will be of great help. Start using...

Tables, the unsung hero of infographics. They say a picture is worth a thousand words, but a well-designed table can convey even more information in the blink of an eye. And with editable templates like this one for Google Slides and PowerPoint, the creative possibilities are endless. Tables don't have...

Download the Types of Business Structures Infographics template for PowerPoint or Google Slides to get the most out of infographics. Whether you want to organize your business budget in a table or schematically analyze your sales over the past year, this set of infographic resources will be of great help....
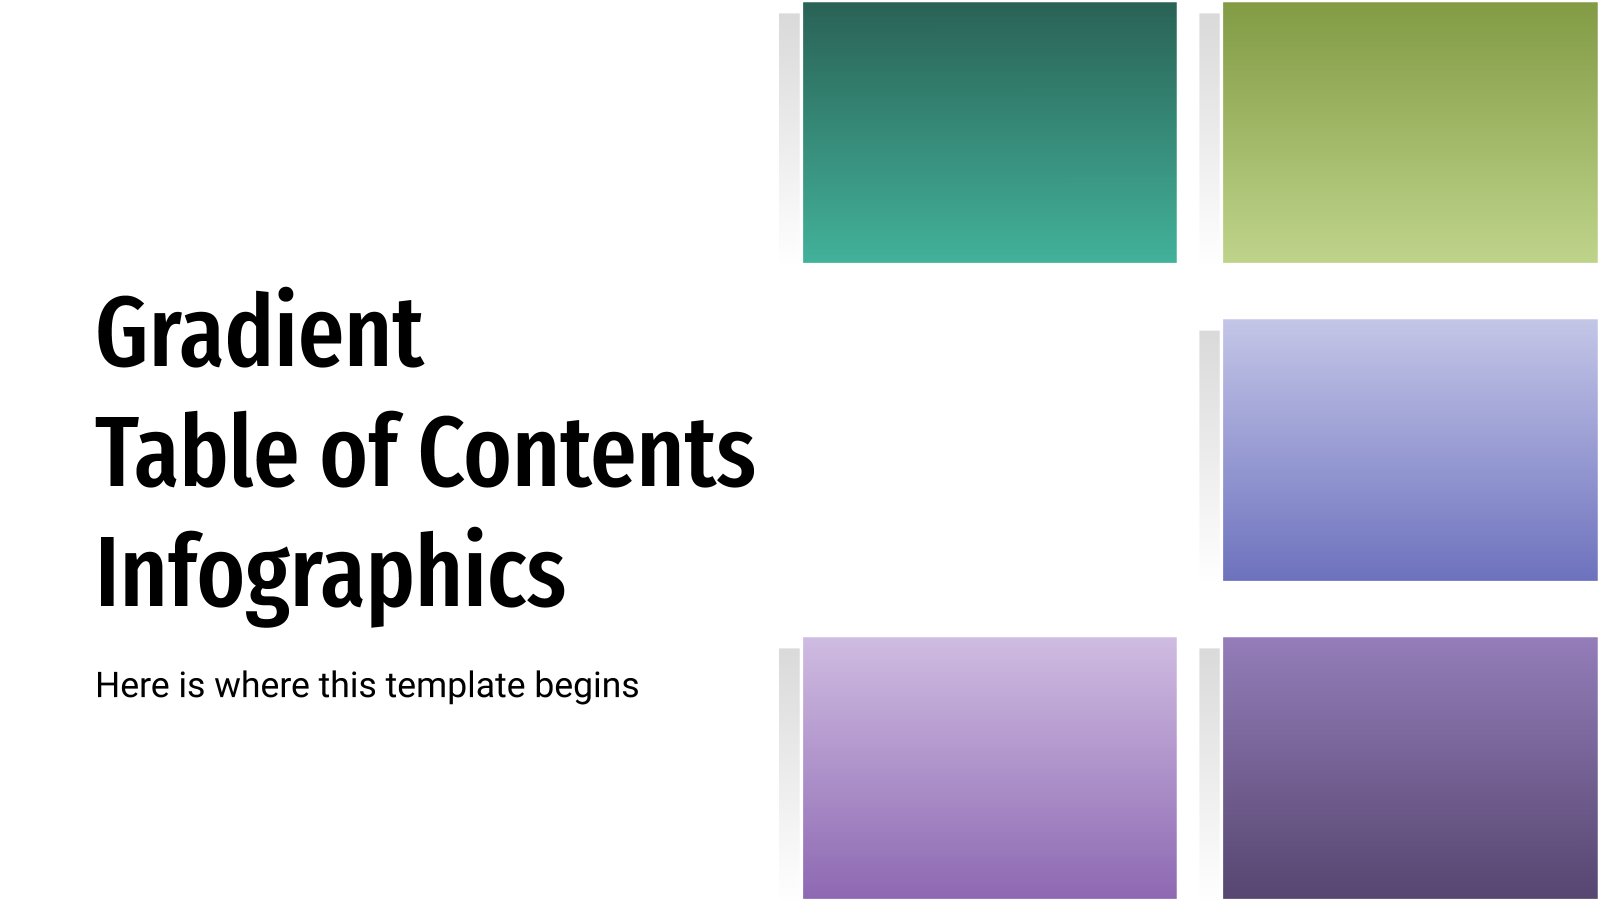
Before formally starting your speech and going into detail, it is nice if you include a table of contents so your audience knows what's coming up. Download this template and modify these infographic designs featuring color gradients. No matter the topic, introduce it to everyone and let them enjoy your...

We want to travel again! It has been a tough few years of pandemic, which has disrupted and changed our lives. However, the desire to explore new places is still there. Since we think there is nothing more visual and explanatory than an infographic, we have prepared a set of...