Business Presentation templates - Page 329
Engage your audience in your business presentations with our free customizable PPT templates and Google Slides themes. They’re perfect for business plans, office meetings, pitch decks or project proposals.


It seems that you like this template!

Register for free and start downloading now
If there is a moment of the day that we all look forward to, it’s the one of the drinks with friends in the pub. Those are the moments of disconnection that we enjoy after a long day at work. If you are thinking of opening one or you already...

What happens when a customer becomes interested in a product and wants to purchase it? He goes into a "journey", and that's what you can explain with these infographics. They contain gradients, a vivid color palette and many different designs!

Job recruiters have lots of resources and tricks to gather all the needed information from applicants, and one of them is the STAR method. Talk about it in front of an audience and use these infographics as a support. All the designs contain four elements, one for each letter (Situation,...

Are you an expert in sales and you're trying to explain the market and what portion of it is reallisticaly reachable? With these infographics, you can talk about the TAM, SAM and SOM. Of course, there are three elements in all the slides and each one has a different color....

Let’s organize your next company meeting with this futuristic template with organic shapes and curves. Due to its design, it can be great for enterprises related to the business industry. Talk about the agenda, project schedule, timeline, status report and upcoming reports.

Present your portfolio to clients and recruiters using this modern presentation. This design includes geometric shapes, slides about you, what you do, experience and your work. It’s fully editable!

Download the Tech Trends Infographics template for PowerPoint or Google Slides to get the most out of infographics. Whether you want to organize your business budget in a table or schematically analyze your sales over the past year, this set of infographic resources will be of great help. Start using...

There's a new season coming up, so try to think of ways of keeping your sales on the top end of the charts! Our new template is filled to the brim with imagery and resources related to winter. The palette is cool, revolving around blue tones, and the slides are...

Download the Diagram Infographics template for PowerPoint or Google Slides to get the most out of infographics. Whether you want to organize your business budget in a table or schematically analyze your sales over the past year, this set of infographic resources will be of great help. Start using infographics...

Download the Tech Trends Infographics template for PowerPoint or Google Slides to get the most out of infographics. Whether you want to organize your business budget in a table or schematically analyze your sales over the past year, this set of infographic resources will be of great help. Start using...

Download the Deep in the Metaverse presentation for PowerPoint or Google Slides and start impressing your audience with a creative and original design. Slidesgo templates like this one here offer the possibility to convey a concept, idea or topic in a clear, concise and visual way, by using different graphic...
Are you looking for a way to represent a 30-, 60- or a 90-day process in a visual manner so it is understandable for your audience? We're bringing you some flat, semi-flat and doodle-like designs depicting different types of infographics. Arrows, tables and other extra resources are also provided for...

Looking for a slideshow where you talk a bit about detectives and the services they offer? The topic might sound serious, so we've opted for a more casual look in this template. The different hand-drawn illustrations of clouds and cities, and the fonts might remind you of comic books, conveying...

Download the Social Media Infographics template for PowerPoint or Google Slides to get the most out of infographics. Whether you want to organize your business budget in a table or schematically analyze your sales over the past year, this set of infographic resources will be of great help. Start using...

Understanding big blocks of information can be hard, but how about you represent it in the form of a dashboard? Make use of our designs now to do so! All our slides have been designed in a linear style, meaning the shapes have no fill color. Bar graphs, pie charts,...

Download the Comparison Charts Infographics template for PowerPoint or Google Slides to get the most out of infographics. Whether you want to organize your business budget in a table or schematically analyze your sales over the past year, this set of infographic resources will be of great help. Start using...

Is your restaurant offering a special menu during Christmas time? Download this template, which has been designed in print-ready A4 format, and complete it with your starters, main dishes and desserts. We've added an allergens list too, just in case you need it. Oh, and the thematic ornaments, you'll love...
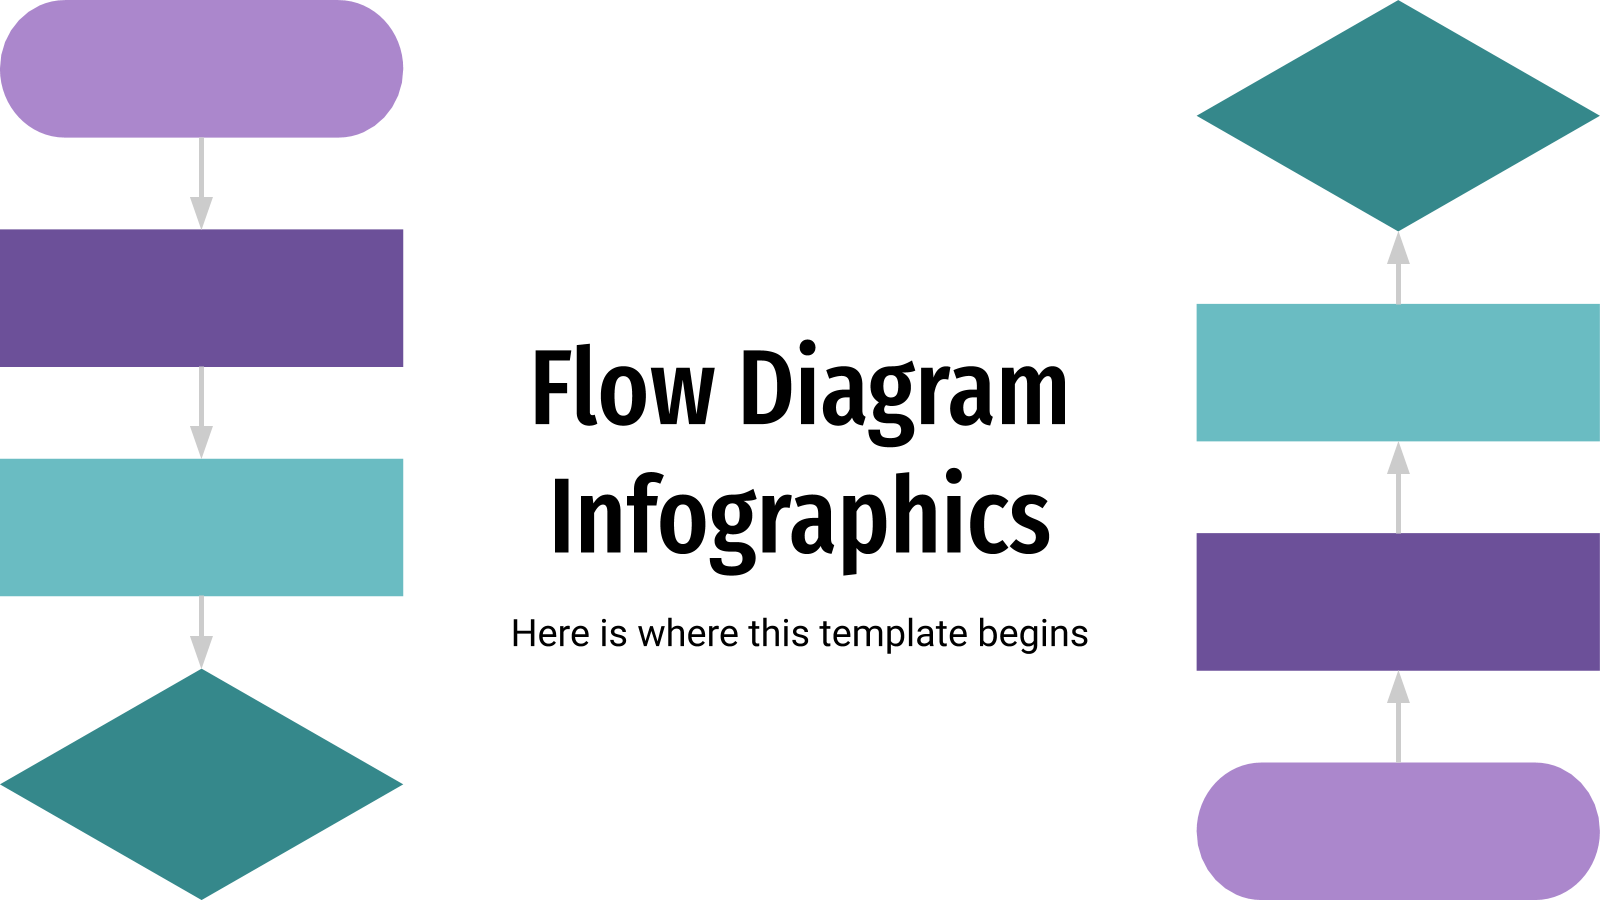
Flow diagrams are used to represent a process or a workflow, along with the possible decisions to take. Download this set of infographics and edit them accordingly. Because making things easier to understand is better than having a hard time trying to explain everything time and time again!