
Business Presentation templates - Page 104
Engage your audience in your business presentations with our free customizable PPT templates and Google Slides themes. They’re perfect for business plans, office meetings, pitch decks or project proposals.


It seems that you like this template!
Register for free and start downloading now
If you have created a location app or if you want to talk about different places, represent your data in a visual way with these infographics full of maps, paths, pins, bar charts or even roadmaps. Some of them are flat, other present round edges and isometric designs. Its two...

These Supply Chain Infographics are great to explain the production and relation between a given company and its suppliers until the product reaches the final buyer. It is also great to represent the steps of a product or service until someone buys it. To do so, we have added different...

Create a cool sales strategy for your fashion company with this pitch deck. Talk about problems that you can solve thanks to your product or service, competitors and provide reliable data using infographics and a SWOT analysis.

Every project has its risks. Assess them and show all the information that you’ve gathered in the form of infographics. All of the designs are ready for you to edit accordingly. As a bonus, we’ve included the real deal, a risk management matrix, totally modifiable and customizable.

Here you have some infographics that will help you represent how distribution channels work. Most of the designs are laid out as processes and/or steps, but the cool thing is that there are several different graphic styles used, including hand-drawn and flat. Get to know the world of logistics!

Show on your slides all the information obtained through key performance indicators or KPIs and let your colleagues make sense of it thanks to these free infographics. The main attraction point of this set is the use of gradients in all the designs. Lots of maps, charts and columns are...

Begin editing this new free template if you’re looking for a heartwarming presentation where you promote your consulting services. Yes, the color palette revolves around red-and-orange gradients, but the abstract backgrounds, the dotted patterns and the linear icons are what inspires a sense of professionalism.

How many populated continents are there in the world? Six! That is the exact number of elements you will find in these infographics. Not five, not seven. Use the different timelines and diagrams to display a process consisting of exactly six steps, or compare six pieces of data, or detail...

We think that there are many ways of showing data regarding a budget. Our sets of infographics focus on the isometric perspective, meaning all the graphs and diagrams, be them pies or pyramids or stairs, look as if they were in 3D. Explaining deficit, profit, balance, income and other economic...

If you’re ready to be a true innovative teacher, then start by handing out an impressive CV, like the one you can create with this template. Include your skills, your education, your experience and even a sneak peek of your own website! Let this cool, funny and colorful slideshow be...

Are you looking for a futuristic template for your Annual SEO Project Report? This presentation is full of city lights, pictures and neon hues. Sections such as data analytics, business objectives and social media will be great for any marketing-related purpose.

Sometimes less is more. When you have to present marketing strategies to your clients, it’s best to opt for clean, visual and simple designs that allow you to focus on what is truly important. This template is designed with a clean background in white and orange tones and different resources...

A great economist needs a great CV in order to land a job in a great company. Slidesgo is your helper today! Design a resume in the form of a presentation and surprise recruiters with such a professional presentation of your experience and skills. We've included some triangular shapes and...

Understanding big blocks of information can be hard, but how about you represent it in the form of a dashboard? Make use of our designs now to do so! All our slides have been designed in a linear style, meaning the shapes have no fill color. Bar graphs, pie charts,...
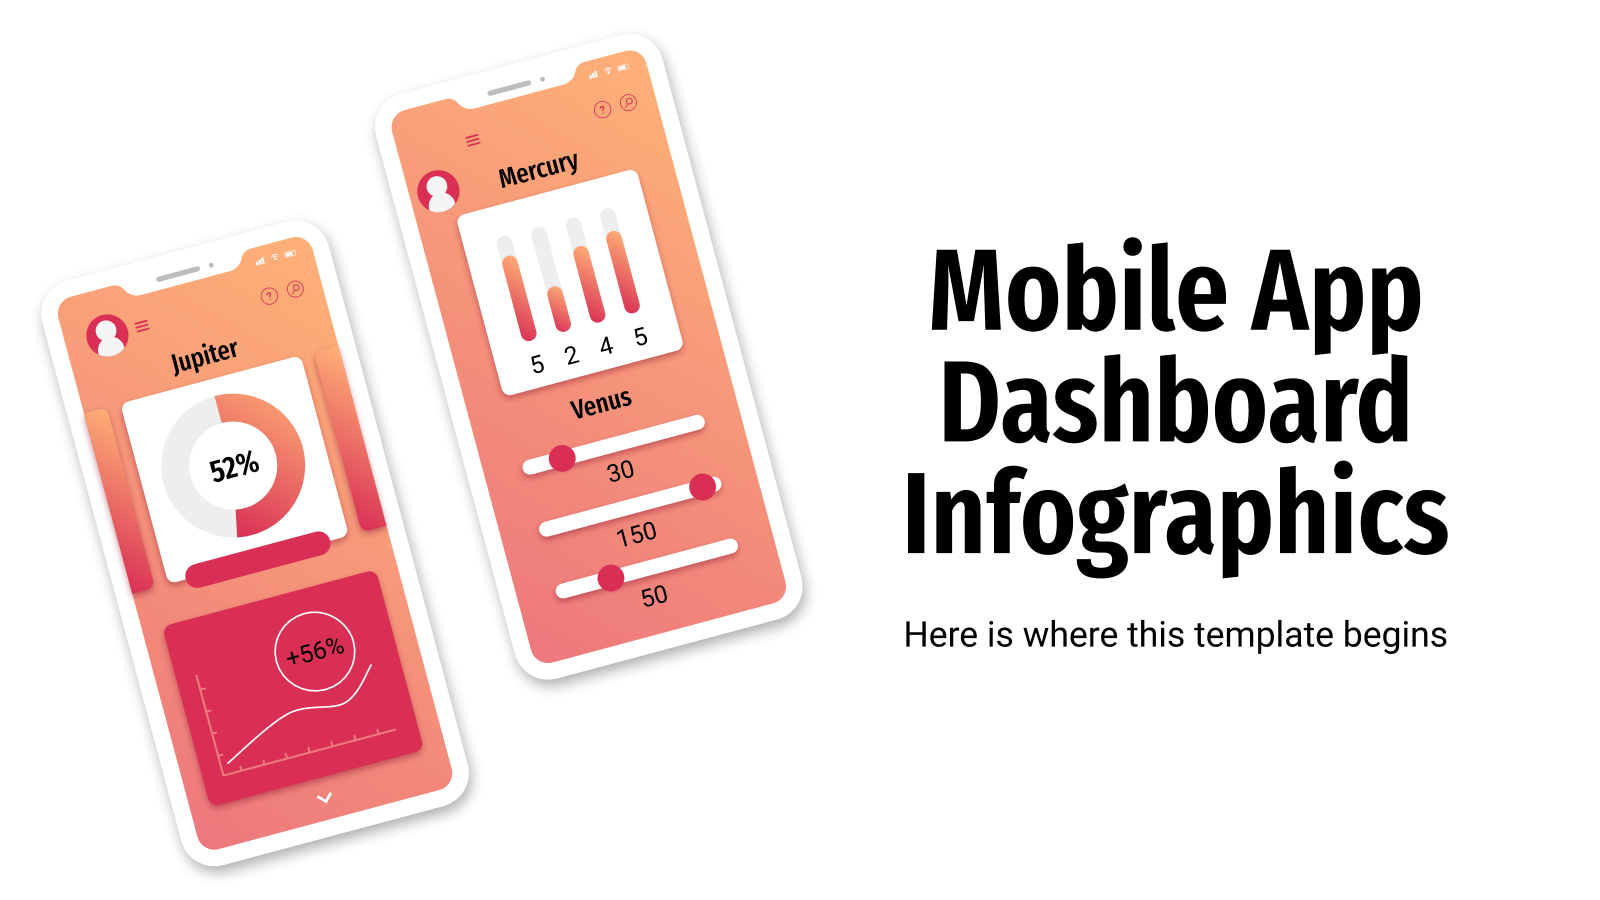
Do you want to be original when presenting information? Infographics are a powerful resource, but how about showing your data like if it were in a mobile app's dashboard? Complete with gauges, icons, gradients and silhouettes of cellphones, these designs will convey visually all the numbers, stats and key performance...

Maturity models assess different aspects of a company, looking for ways to improve performance and resource allocation. You have already the results? Lay them down in these infographics and show them to your colleagues in a visually appealing way. You can edit these graphs and diagrams to reflect your data...

If being a librarian has always been your dream job, try giving your CV a suitable design with the help of this template. It has been created in A4 paper size, ready for printing, and its design is quite elegant, very suitable for the position you're applying for. There's also...

Sometimes, having your content organized is as important as the content itself, especially in slideshows. These infographics are perfect if you need to keep things neat and clean. Financial, learning or organizational processes can be represented with our designs in the form of cards. Start editing them and maximize your...