
Business Presentation templates - Page 101
Engage your audience in your business presentations with our free customizable PPT templates and Google Slides themes. They’re perfect for business plans, office meetings, pitch decks or project proposals.


It seems that you like this template!
Register for free and start downloading now
Use this template to create a pitch deck that endorses shared workspaces. Show the positive aspects of coworking and its benefits, as well as growth, a SWOT analysis and information about your company in general. There are graphs, infographics and icons to take the visual content to the next level!
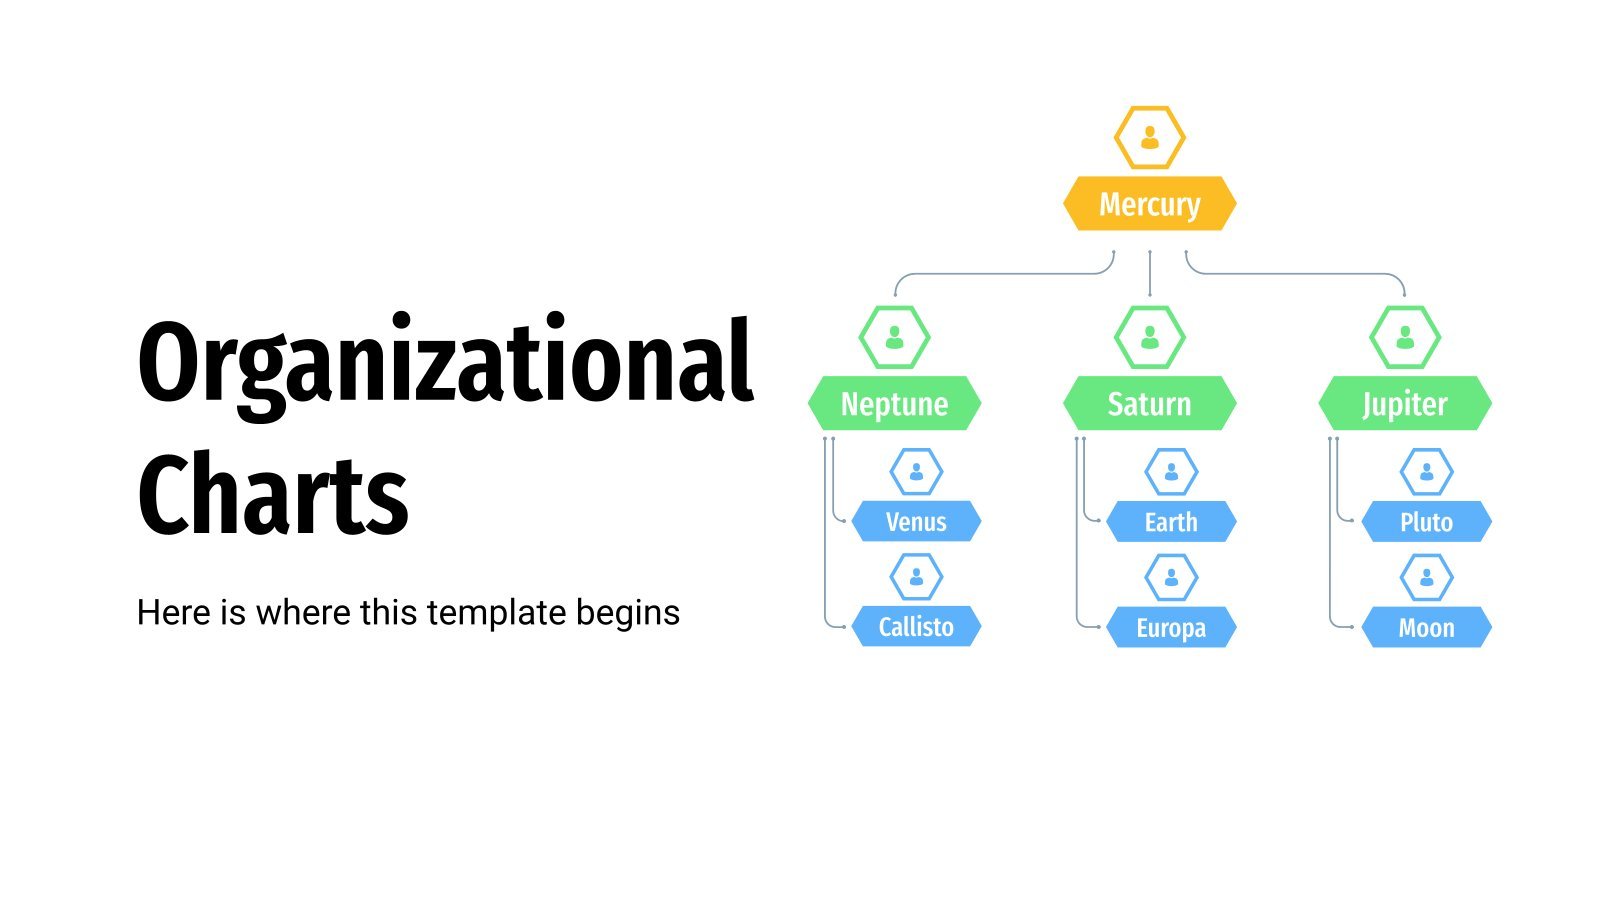
Organizational Charts, also known as organigrams or organograms, present the ranks and relationships within a company or its structure. They typically have three to four levels.

If you need to talk about your business, company or workspace, go ahead and use this vintage presentation. You can personalize the sections to your own needs! Use the tables, pie charts, infographics, percentages and maps to present a project in a meeting, to promote your coworking space or to...

Iceberg infographics are brilliant when applied to business. If you need to capture the evolution of your company or the factors that affect it, this sort of visual aid is perfect for you. Traditionally, those elements at the top are the most obvious ones, while those at the bottom represent...

This Project Proposal presentation is pretty cool. We have inserted a lot of doodles, so it is perfect for your university assignments. There are icons related to education, and the main color of the background is light blue. You’ll also find some yellow lines under the titles. The fonts that...
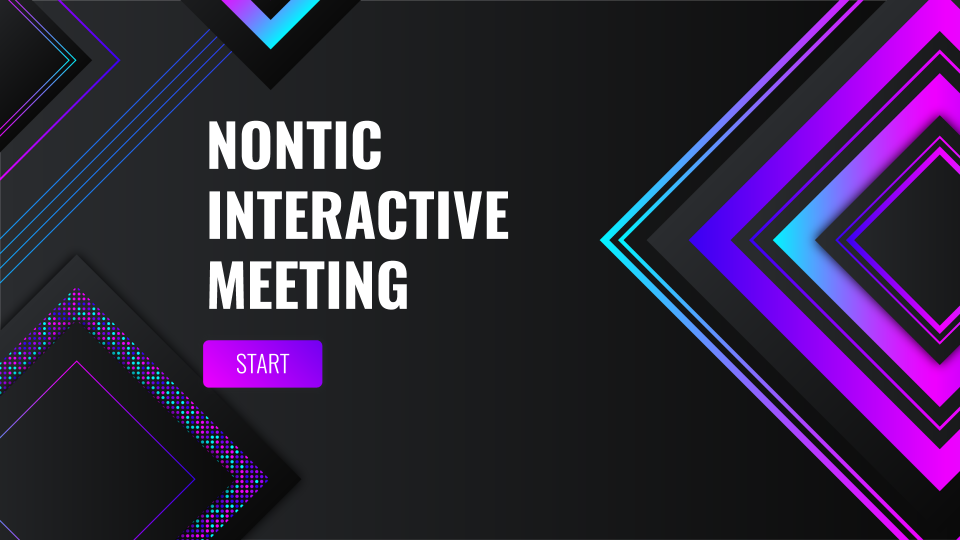
Get your meeting presentation ready! This is an interactive template in which we have added plenty of useful sections: objectives, schedule, agenda, timelines… And lots of buttons, of course! This UX design is futuristic. It is mainly dark gray, and we also include geometric patterns with neon gradients in the...

Explain your goals and objectives or how to achieve them with these infographics! Tell your audience about what you want to achieve to get new clients, measure your success and encourage your team using these diagrams. Some of them look like mountains, bullseyes, tables, roadmaps, stairs, tables…

Share the details and planification of your next meeting using this presentation. It’s minimalist and it includes different sections such as project schedule, project timeline, status and upcoming report. We have also added tables, infographics and many other visual resources.

Ready to use funnel infographics? They are perfect for business and marketing. Thanks to their conical shapes, you can depict the different steps to achieve your goal (e.g. a given client or lead.) Each section represents a percentage of loss for each stage of the process, that’s why they are...

If you have created a location app or if you want to talk about different places, represent your data in a visual way with these infographics full of maps, paths, pins, bar charts or even roadmaps. Some of them are flat, other present round edges and isometric designs. Its two...

These Supply Chain Infographics are great to explain the production and relation between a given company and its suppliers until the product reaches the final buyer. It is also great to represent the steps of a product or service until someone buys it. To do so, we have added different...
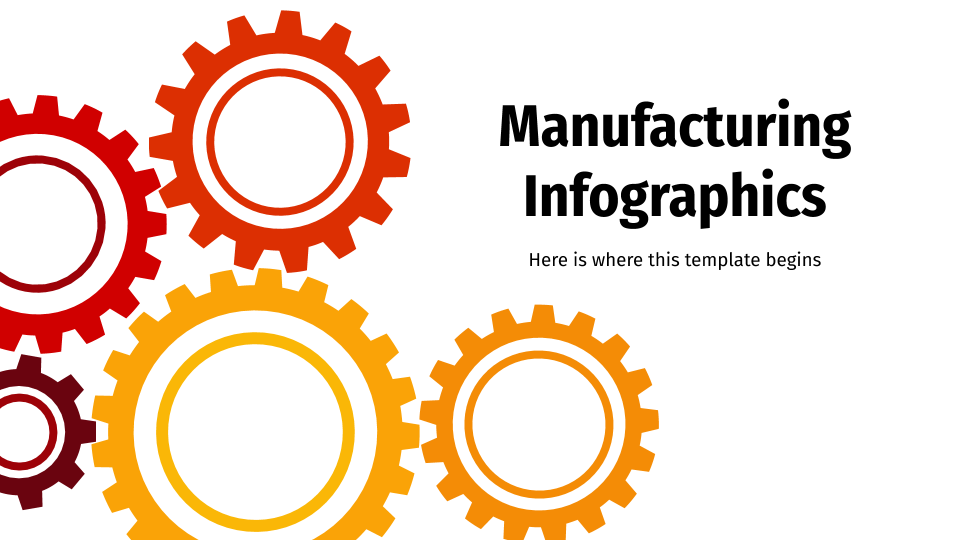
Describe how a product is manufactured in a visual manner with our infographics. Most of our slides show processes or steps, and for that we’ve used circular designs, but there are also roadmaps and tables. What a way to make your presentations stand out!

Is it time to check out how well a project is faring so far? To make it visually appealing, try our infographics. Your reports will look amazing with these designs, which make use of traffic lights or status bars to represent the different stages and their current status. Everything is...

Promote your consulting services and help businesses and organizations balance the books with this template. An abstract design with wavy shapes and some doodles will make your message stand out, trust us!

Do you work in a museum? That’s wonderful! So, you have a meeting soon and you need help with a presentation, right? This new template is so creative it’s almost a piece of art. Talk about the objectives, the upcoming events and provide a little sneak peek of what’s to...

In business or marketing, demographic data is essential to better understand the target audience. Use these infographics to show yours in a clear manner! Make comparisons, add percentages and organize everything in our selection of designs. Most of them have illustrations or icons that will boost your visuals!

This time, we’ve designed some infographics with illustrations of buildings. How about you use their varied heights to your advantage and visually explain some numeric data? Apart from this, there are also some timelines, maps and even donut charts, among others, that you can use to show a process or...

In business, it’s important to compare qualities, features and prices of different products or services in the market. Use these free infographics to stand out from the competition and talk about market share, strengths, weaknesses, profit and many more essential info for your colleagues or higher-ups!