Business Infographics Presentation templates - Page 4
Thinking about new techniques to improve your company performance? Try our effective infographics for Google Slides and PowerPoint and present your data and results easily!


It seems that you like this template!

Register for free and start downloading now
Download the "Business Plan Infographics" template for PowerPoint or Google Slides to get the most out of infographics. Whether you want to organize your business budget in a table or schematically analyze your sales over the past year, this set of infographic resources will be of great help. Start using...

Download the "Cycle Diagrams Theme for a Company Profile" presentation for PowerPoint or Google Slides. Presenting a comprehensive company profile can be a game-changer for your business. A well-crafted profile connects with potential clients and vendors on another level, giving them a deep understanding of your organization. This company profile...
The following set of infographics has been designed to represent the making of business processes. As such, most of the designs involve different steps or phases, each one with different colors for maximum clarity. Some slides incorporate timelines, others make use of cycle diagrams, others look like tables... There's a...
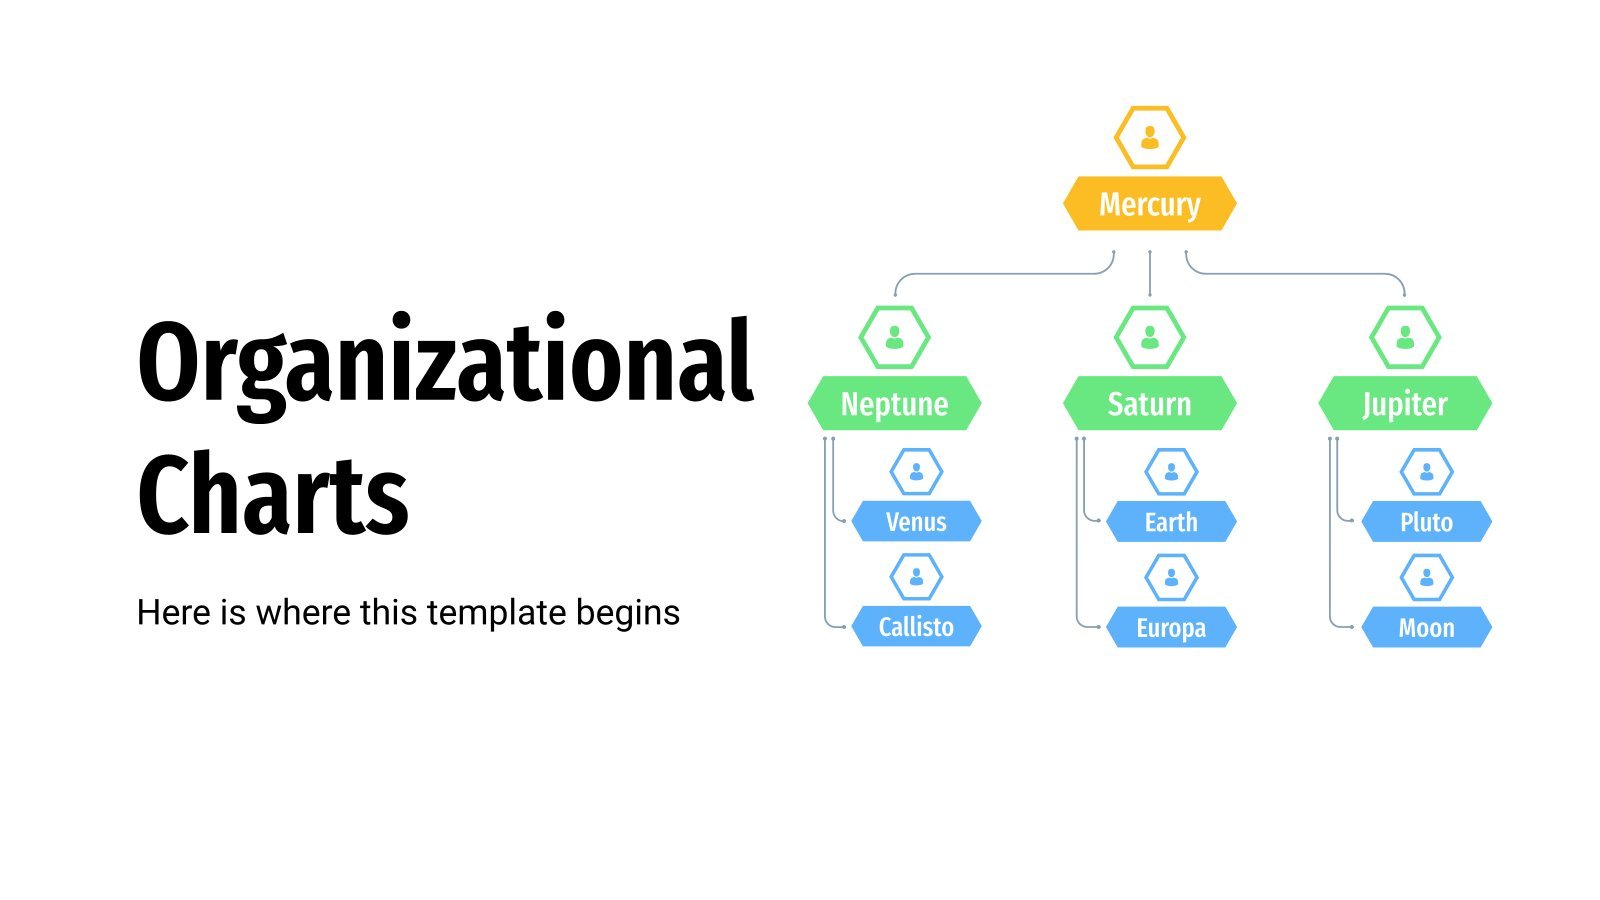
Organizational Charts, also known as organigrams or organograms, present the ranks and relationships within a company or its structure. They typically have three to four levels.

Download the Simple Quadrants Infographics template for PowerPoint or Google Slides to get the most out of infographics. Whether you want to organize your business budget in a table or schematically analyze your sales over the past year, this set of infographic resources will be of great help. Start using...

Download the Change Management Process: Flow Diagrams for a Business Plan Infographics presentation for PowerPoint or Google Slides. Conveying your business plan accurately and effectively is the cornerstone of any successful venture. This template allows you to pinpoint essential elements of your operation while your audience will appreciate the clear...

Download the Timeline Infographics template for PowerPoint or Google Slides to get the most out of infographics. Whether you want to organize your business budget in a table or schematically analyze your sales over the past year, this set of infographic resources will be of great help. Start using infographics...

Download the Business Diagram Infographics template for PowerPoint or Google Slides to get the most out of infographics. Whether you want to organize your business budget in a table or schematically analyze your sales over the past year, this set of infographic resources will be of great help. Start using...

Download the Simple Quadrants Infographics template for PowerPoint or Google Slides to get the most out of infographics. Whether you want to organize your business budget in a table or schematically analyze your sales over the past year, this set of infographic resources will be of great help. Start using...

Download the Business Diagram Infographics template for PowerPoint or Google Slides to get the most out of infographics. Whether you want to organize your business budget in a table or schematically analyze your sales over the past year, this set of infographic resources will be of great help. Start using...
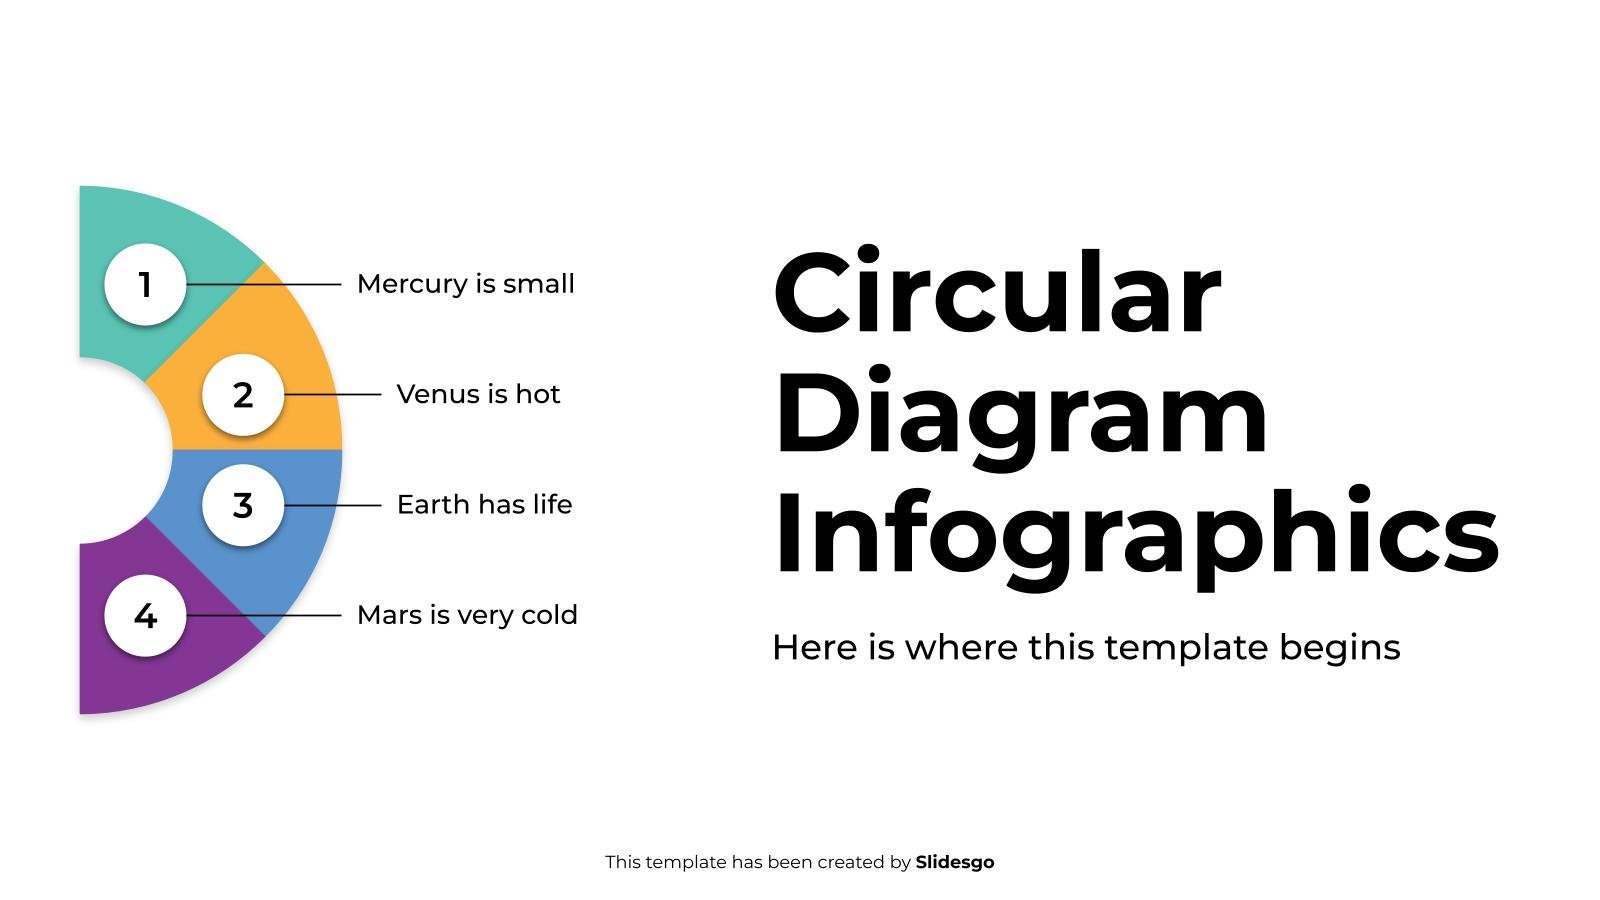
Download the Circular Diagram Infographics template for PowerPoint or Google Slides to get the most out of infographics. Whether you want to organize your business budget in a table or schematically analyze your sales over the past year, this set of infographic resources will be of great help. Start using...
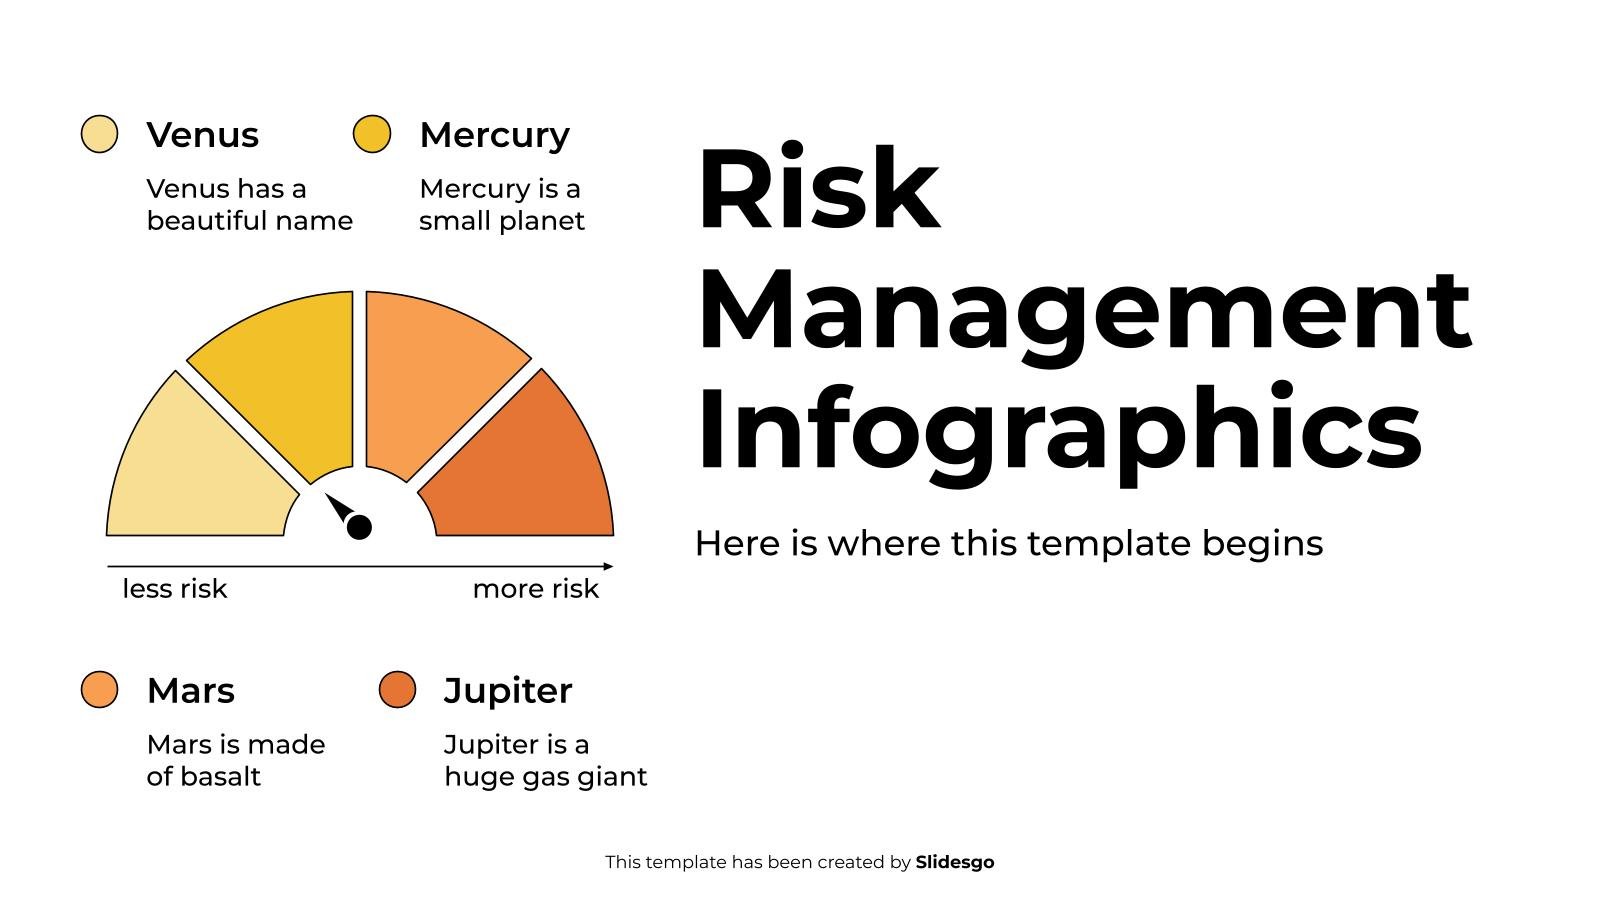
Download the Risk Management Infographics template for PowerPoint or Google Slides to get the most out of infographics. Whether you want to organize your business budget in a table or schematically analyze your sales over the past year, this set of infographic resources will be of great help. Start using...

Download the Strategic Roadmap Infographics template for PowerPoint or Google Slides to get the most out of infographics. Whether you want to organize your business budget in a table or schematically analyze your sales over the past year, this set of infographic resources will be of great help. Start using...

Download the Canvas Business Model Infographics template for PowerPoint or Google Slides to get the most out of infographics. Whether you want to organize your business budget in a table or schematically analyze your sales over the past year, this set of infographic resources will be of great help. Start...

Understanding big blocks of information can be hard, but how about you represent it in the form of a dashboard? Make use of our designs now to do so! All our slides have been designed in a linear style, meaning the shapes have no fill color. Bar graphs, pie charts,...
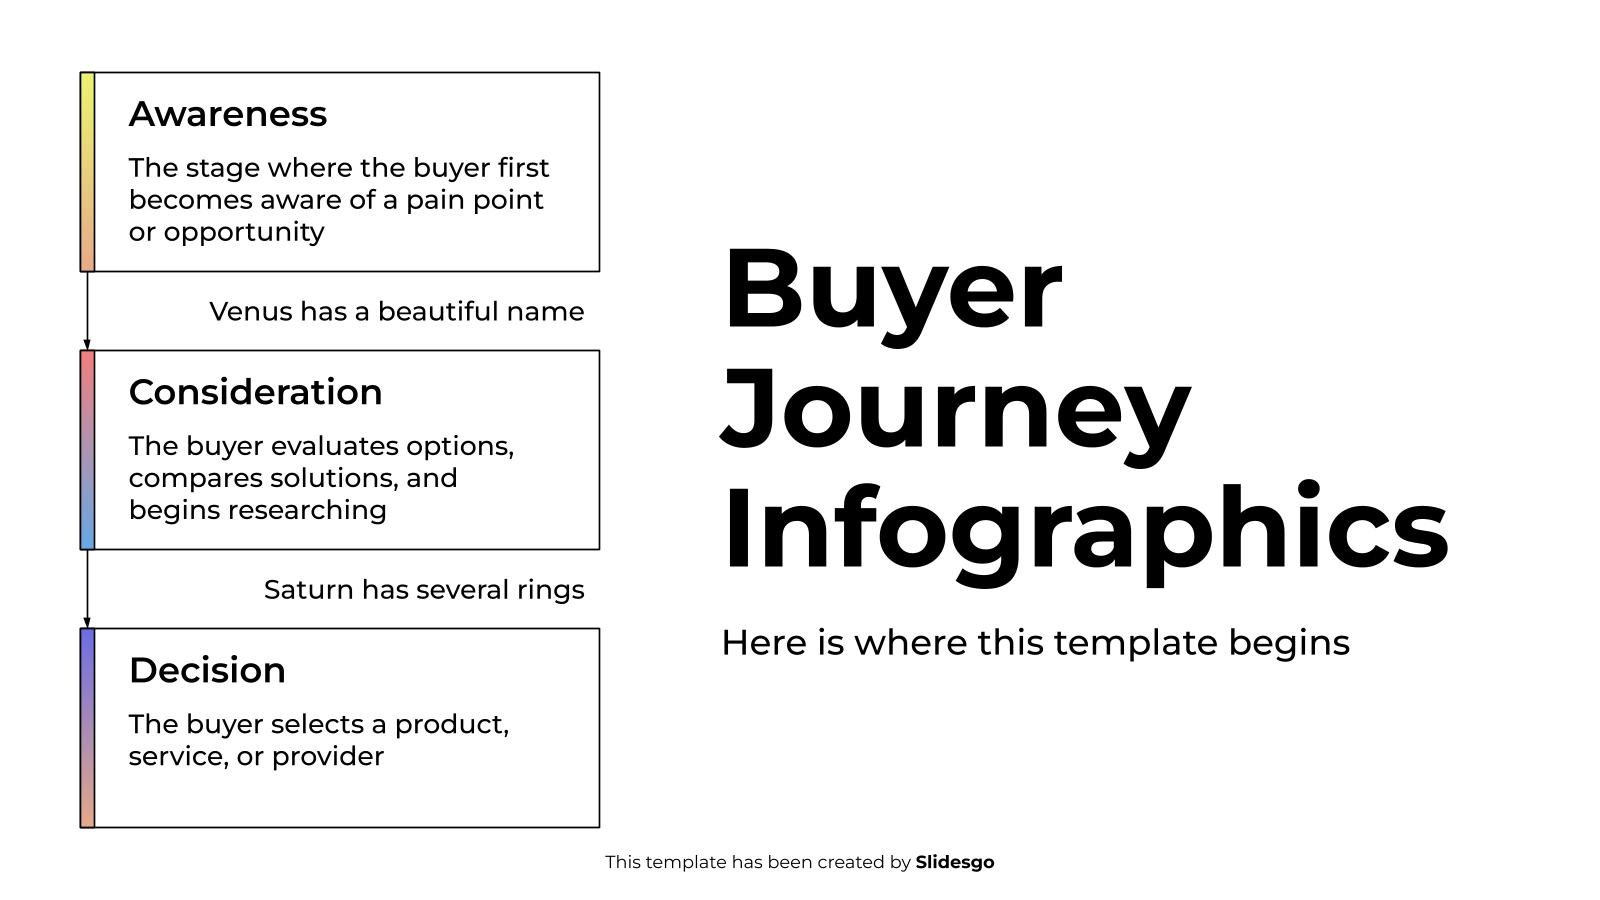
Download the Buyer Journey Infographics template for PowerPoint or Google Slides to get the most out of infographics. Whether you want to organize your business budget in a table or schematically analyze your sales over the past year, this set of infographic resources will be of great help. Start using...
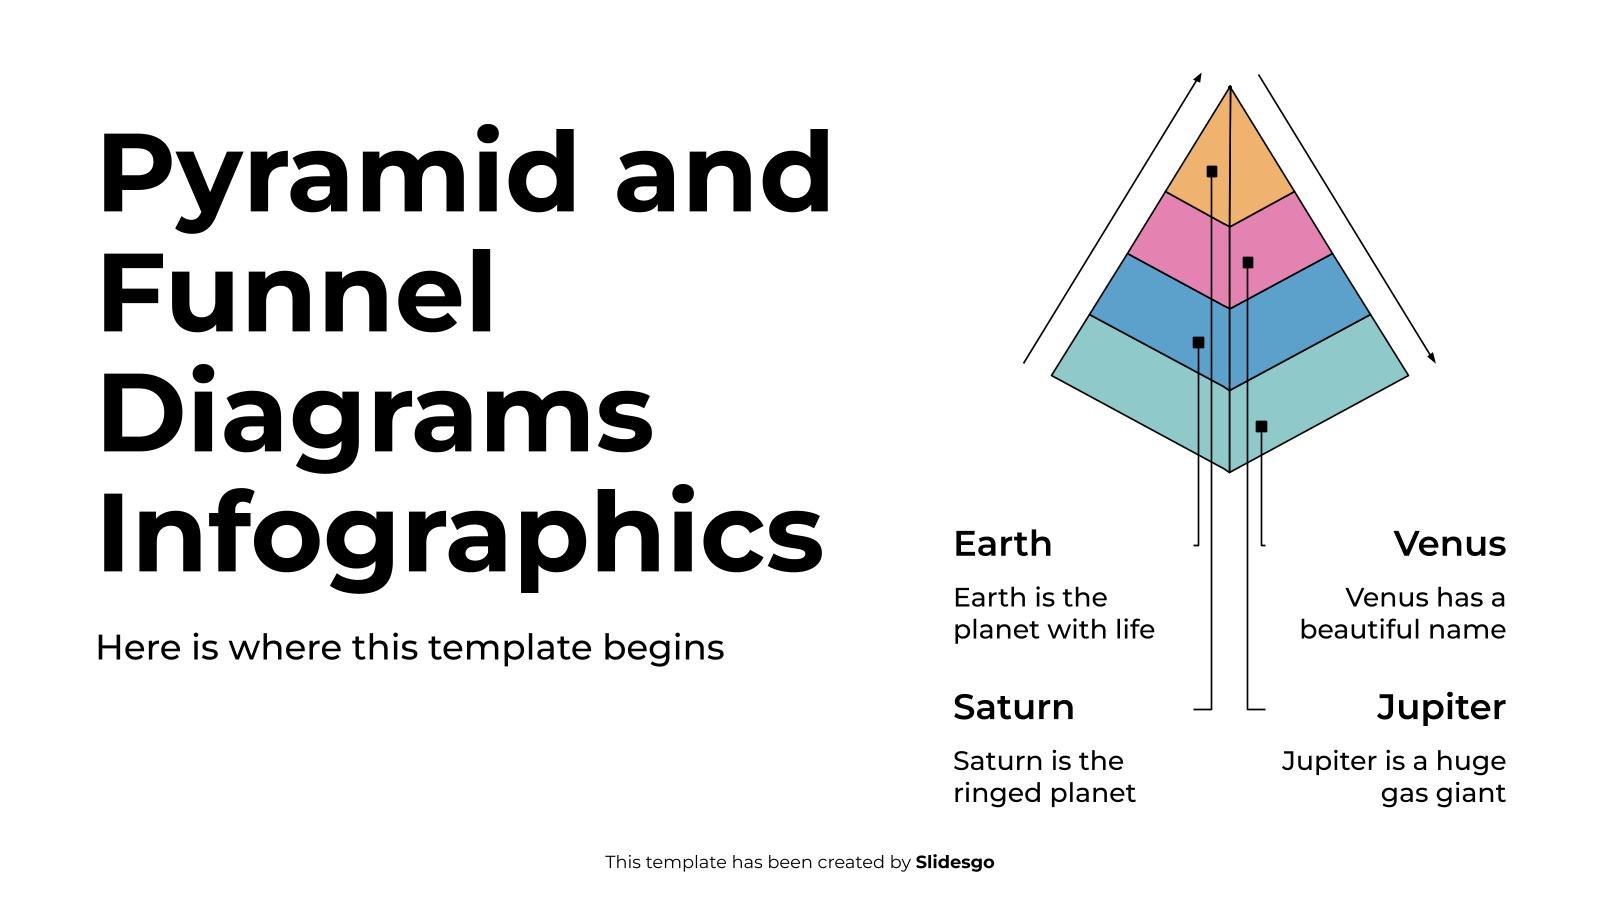
Download the Pyramid and Funnel Diagrams Infographics template for PowerPoint or Google Slides to get the most out of infographics. Whether you want to organize your business budget in a table or schematically analyze your sales over the past year, this set of infographic resources will be of great help....

Tables, the unsung hero of infographics. They say a picture is worth a thousand words, but a well-designed table can convey even more information in the blink of an eye. And with editable templates like this one for Google Slides and PowerPoint, the creative possibilities are endless. Tables don't have...