Business Infographics Presentation templates - Page 3
Thinking about new techniques to improve your company performance? Try our effective infographics for Google Slides and PowerPoint and present your data and results easily!


It seems that you like this template!

Register for free and start downloading now
Download the Elegant Digital Lavender Business Basic Template Infographics template for PowerPoint or Google Slides and discover the power of infographics. An infographic resource gives you the ability to showcase your content in a more visual way, which will make it easier for your audience to understand your topic. Slidesgo...

Spreadsheets are part of everyday business, what if you could give them a twist and make them more visually appealing? With this infographic template you will easily capture the attention of your boss, colleagues and clients. They are made in blue, which conveys serenity, and have different structures so you...

Download the Business Model Canvas Infographics template for PowerPoint or Google Slides to get the most out of infographics. Whether you want to organize your business budget in a table or schematically analyze your sales over the past year, this set of infographic resources will be of great help. Start...
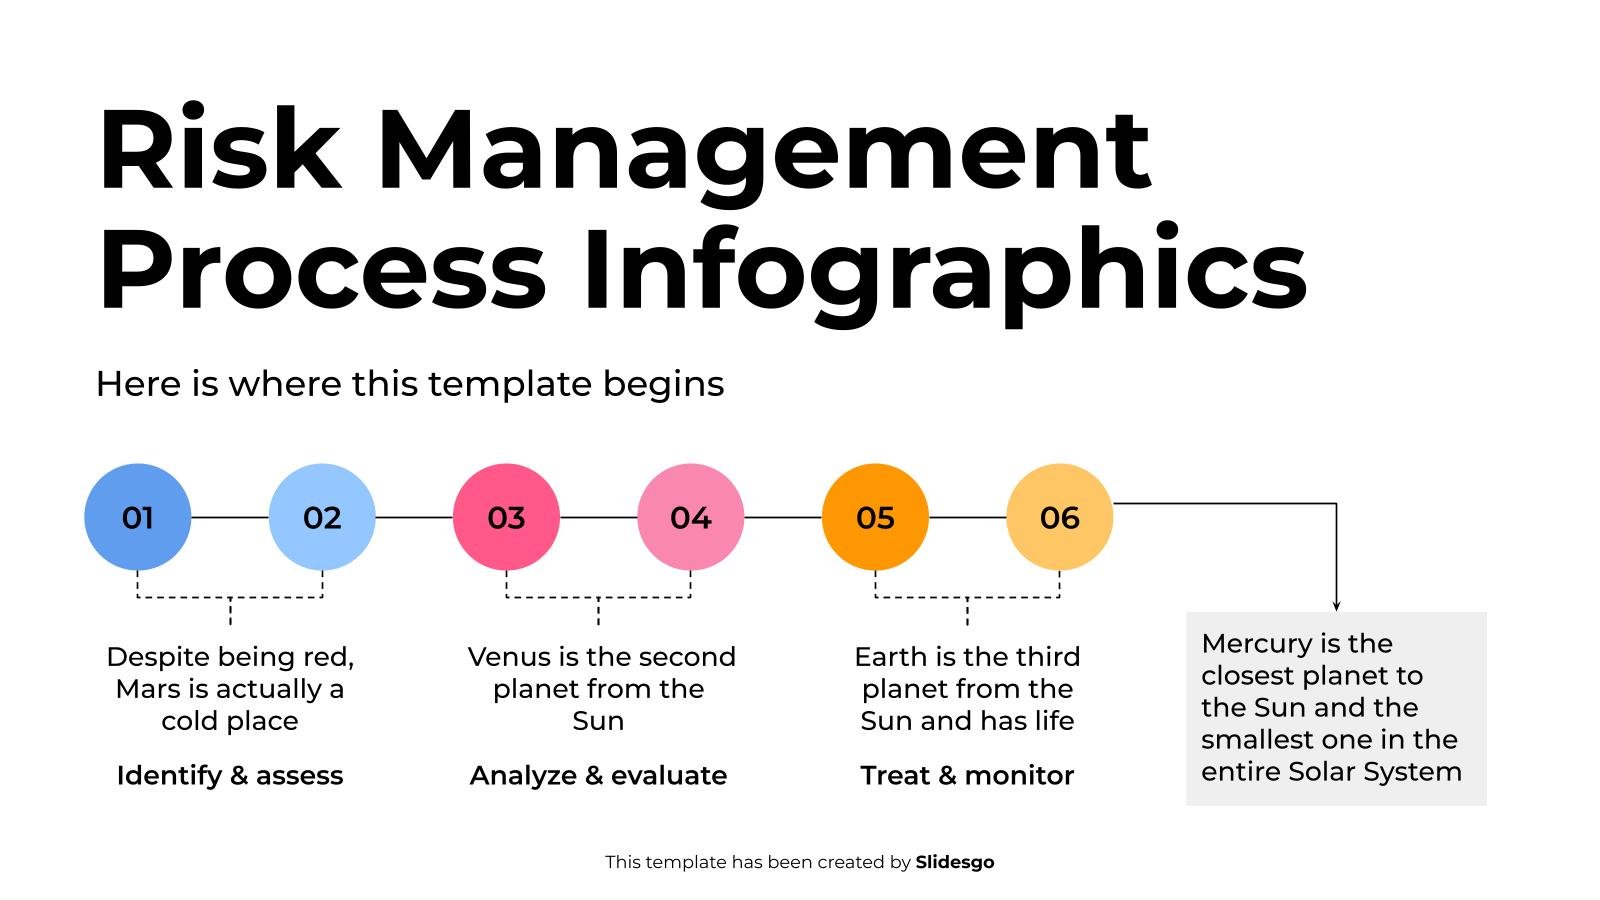
Download the Risk Management Process Infographics template for PowerPoint or Google Slides to get the most out of infographics. Whether you want to organize your business budget in a table or schematically analyze your sales over the past year, this set of infographic resources will be of great help. Start...

If you want to give a "pastel" touch to your business, try using this set of infographics in your presentations! You'll find all kinds of resources you'll need when talking about your company: graphs, timelines, tables or diagrams—all of them are very easy to use! Edit the infographic you want...

Download the Vivid Colors for Business Infographics template for PowerPoint or Google Slides and discover the power of infographics. An infographic resource gives you the ability to showcase your content in a more visual way, which will make it easier for your audience to understand your topic. Slidesgo infographics like...
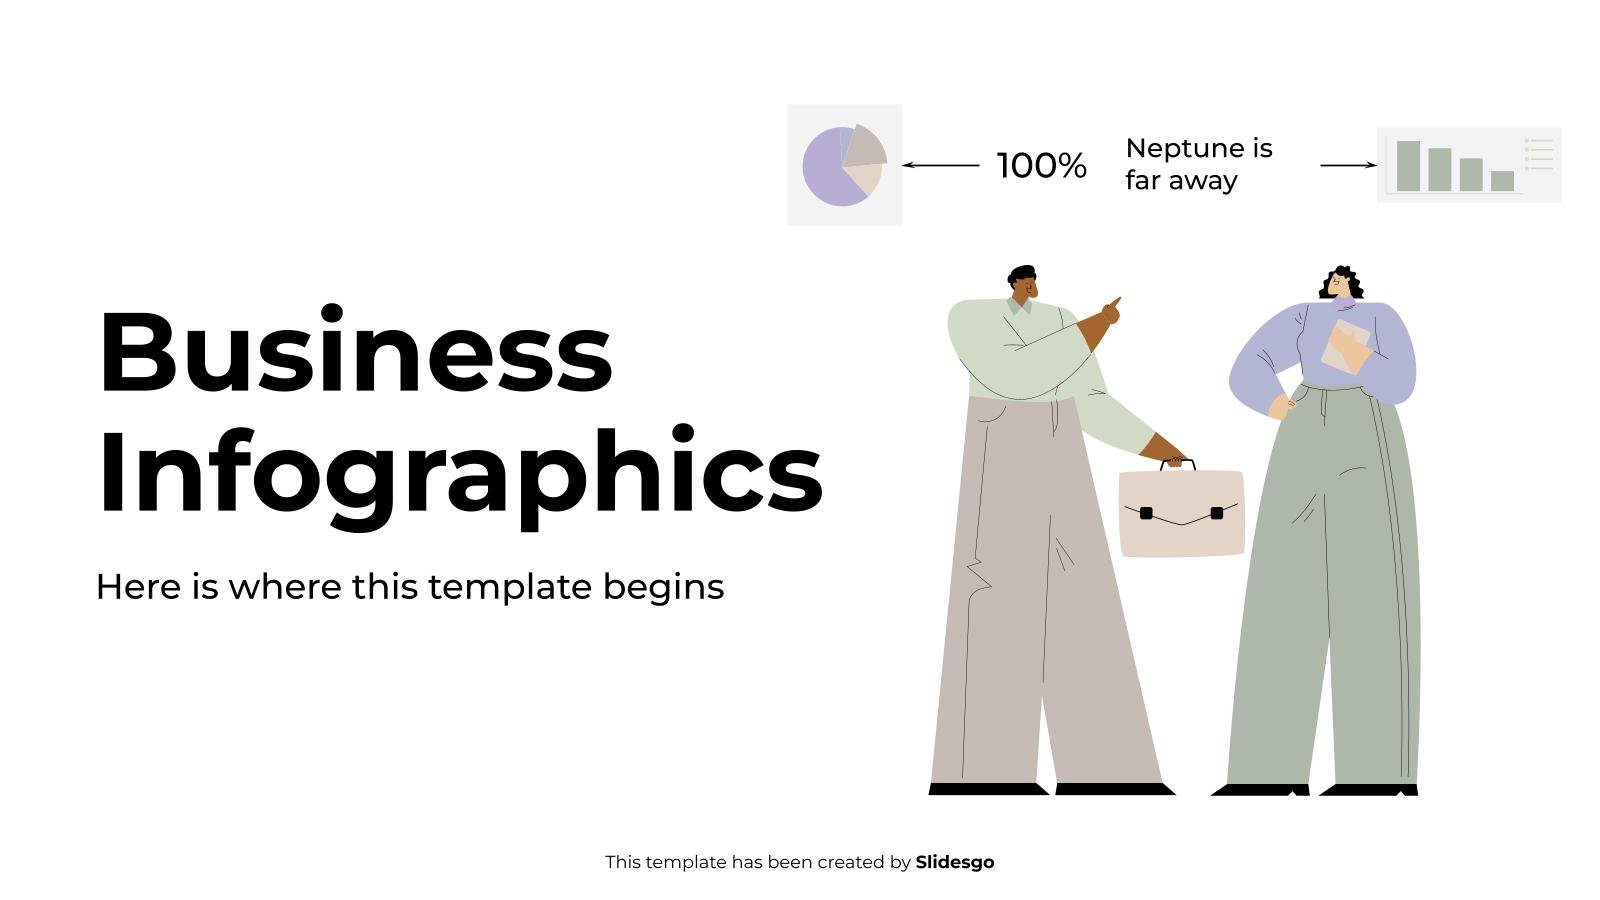
Download the Business Infographics template for PowerPoint or Google Slides to get the most out of infographics. Whether you want to organize your business budget in a table or schematically analyze your sales over the past year, this set of infographic resources will be of great help. Start using infographics...
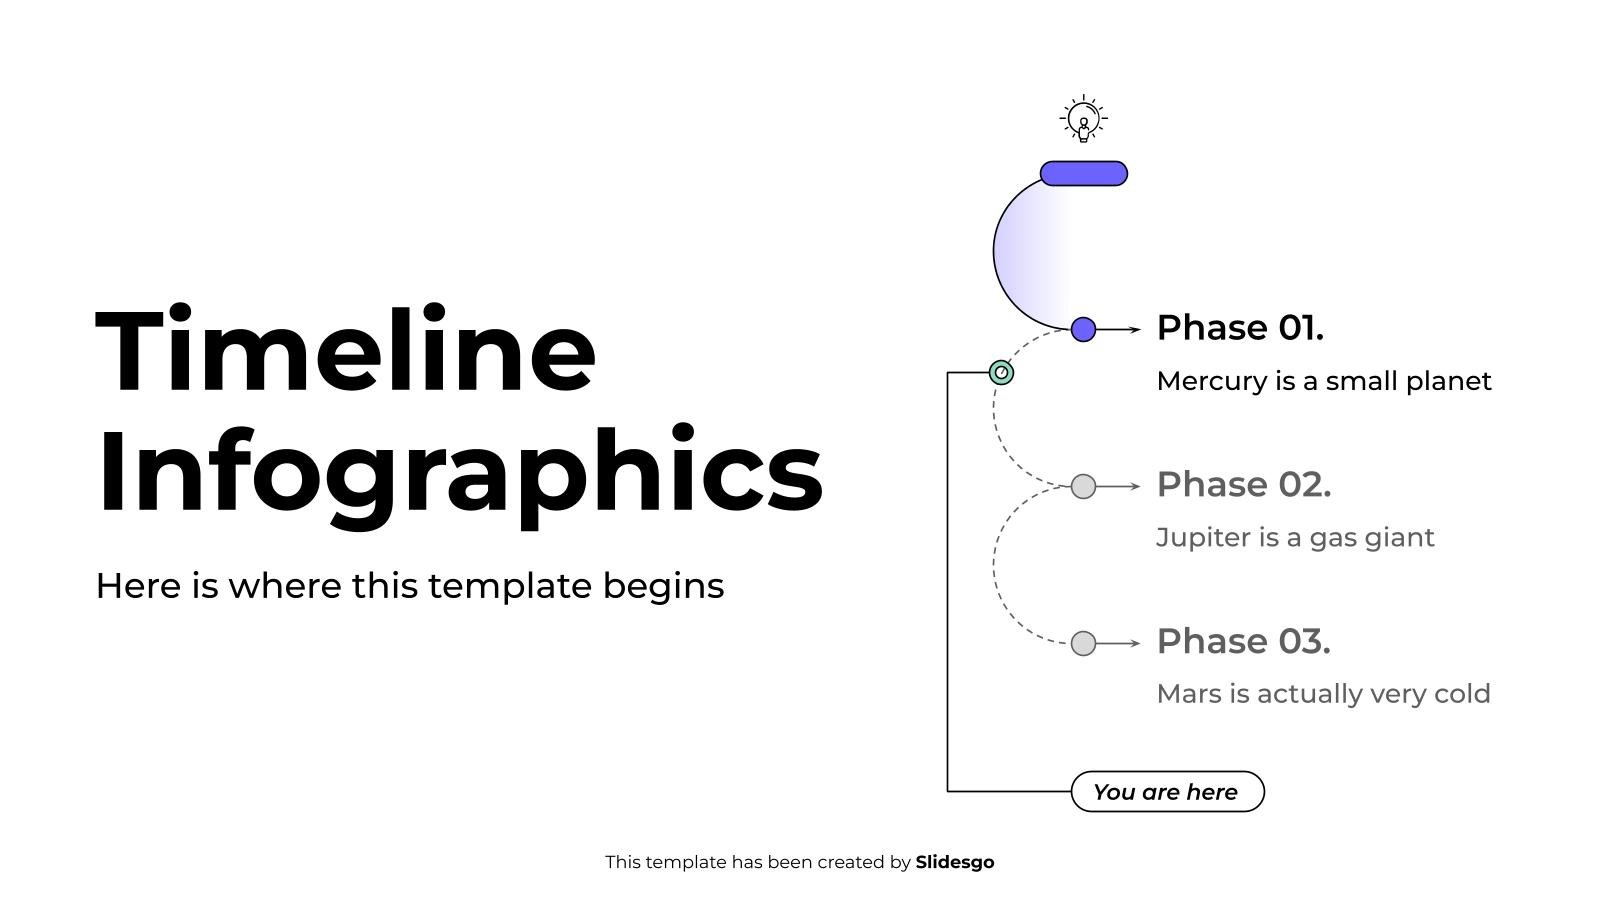
Download the Timeline Infographics template for PowerPoint or Google Slides to get the most out of infographics. Whether you want to organize your business budget in a table or schematically analyze your sales over the past year, this set of infographic resources will be of great help. Start using infographics...

Representing data visually is easier than you think. For any purpose related to business, we've designed these minimalist infographics. There are timelines to present information over time, or tables to organize data, or diagrams to explain processes... there's almost everything! In fact, we've included a varied number of elements in...

Download the Roadmap Infographics template for PowerPoint or Google Slides to get the most out of infographics. Whether you want to organize your business budget in a table or schematically analyze your sales over the past year, this set of infographic resources will be of great help. Start using infographics...

Planning is the key to success in any company. Organizing and planning your future projects will allow you to know the needs of each one of them and schedule in advance all the necessary tasks. For this reason, today we bring you 32 infographics that are timelines, for you to...

Download the Puzzle Infographics template for PowerPoint or Google Slides to get the most out of infographics. Whether you want to organize your business budget in a table or schematically analyze your sales over the past year, this set of infographic resources will be of great help. Start using infographics...

Download the Buyer Journey Infographics template for PowerPoint or Google Slides to get the most out of infographics. Whether you want to organize your business budget in a table or schematically analyze your sales over the past year, this set of infographic resources will be of great help. Start using...

Cycle diagrams are great if you want to depict a circular flow of a series of steps, stages or events that interact between each other repeatedly without a clear end. Use them when talking about company processes, in marketing, health or for educational purposes. Of course, the different sections (up...

Download the Circular Diagram Infographics template for PowerPoint or Google Slides to get the most out of infographics. Whether you want to organize your business budget in a table or schematically analyze your sales over the past year, this set of infographic resources will be of great help. Start using...
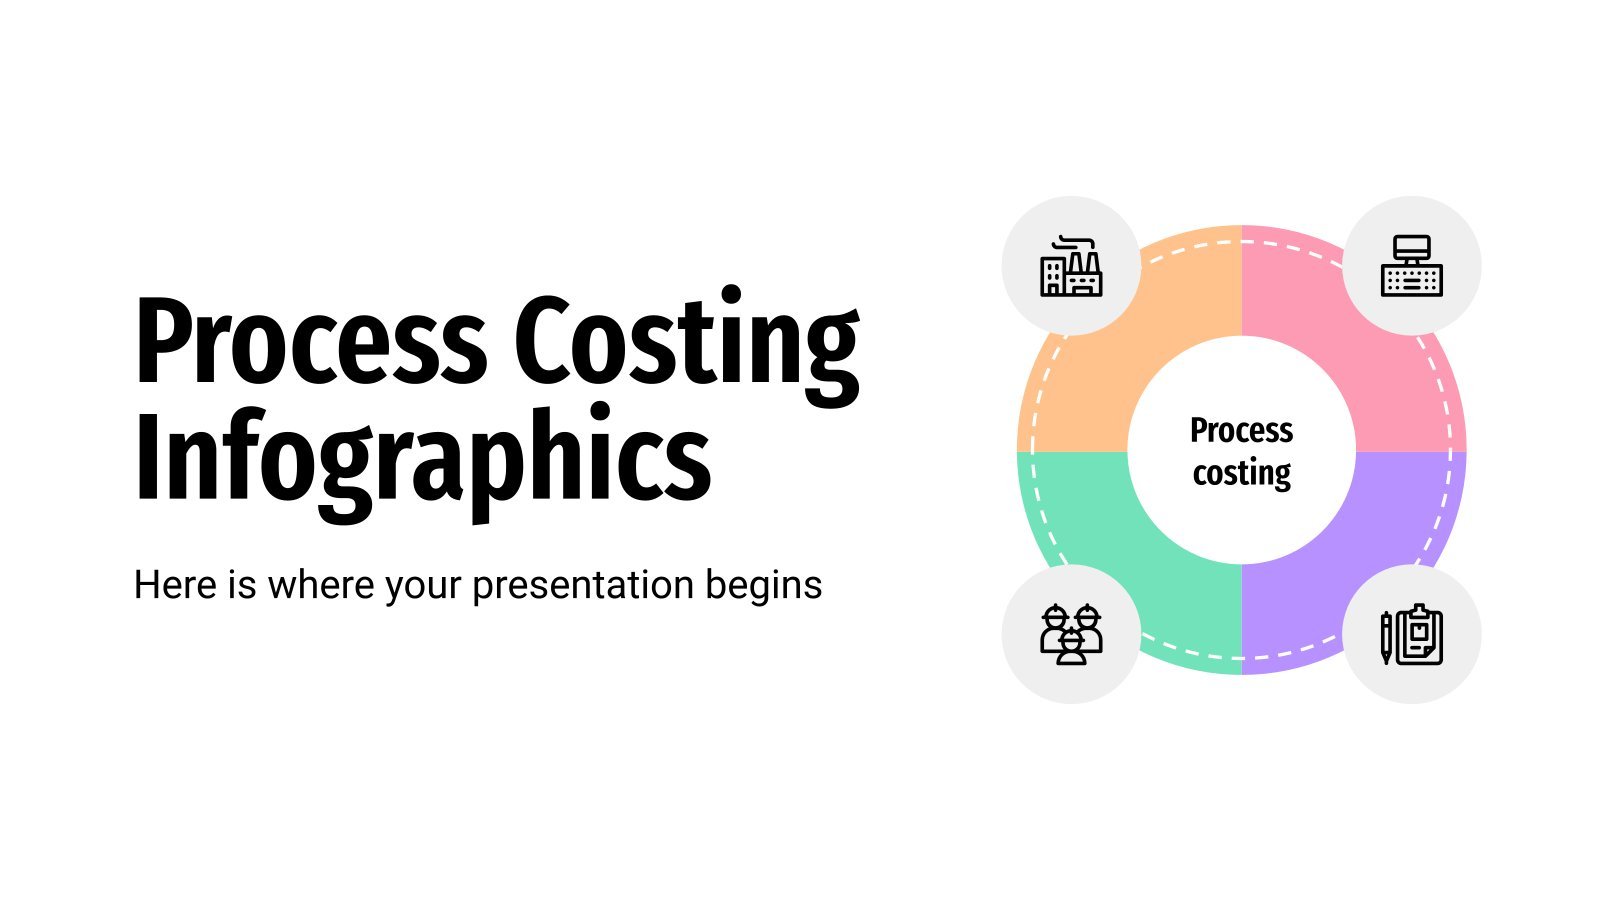
If you work in the manufacturing industry you surely know what process costing is, a methodology that is usually applied in companies that produce similar units massively. If you are preparing a presentation on this topic, this infographic template will be your best ally, because it contains different graphical representations...

How important it is in marketing or in the world of business in general to devise and follow a good strategy to boost sales or revenue. With these infographics, you can talk about yours. We’ve got many resources and designs for you: steps, blocks, tables, comparatives… Let the team know!

Do you want to assess the success or failure of your company? Use these KPI (Key Performance Indicators). It is a great tool to determine if you are achieving a goal or not. Represent your information about actions, strategies or productivity with bar or pie charts, pyramids, tables, percentages, maps......