Business Infographics Presentation templates - Page 29
Thinking about new techniques to improve your company performance? Try our effective infographics for Google Slides and PowerPoint and present your data and results easily!


It seems that you like this template!

Register for free and start downloading now
This new collection of infographics will help you define the budget allocation and show it in your next meeting. With a more professional look thanks to the flat graphic style, all the pie charts, maps, bar graphs, timelines and radial charts are good, compelling additions to your presentations.

These traction infographics present different data categories. They are helpful to deal with investments, companies, startups, goals, big data… We have included bar, circle, pie charts, pyramids, banners.

Is your company's balance sheet looking good? Great! Give a presentation on your next business meeting where you detail a break-even analysis in such a way that everyone attending will understand it at a glance. That can be done thanks to our infographics. We have some that resemble scales, others...

Brainstorming is a technique in which you and your team try to come up with new ideas to solve a problem and it’s a great way of fostering creativity and teamwork. With this set of infographics, you can represent visually the ideas that your team comes up with and organize...
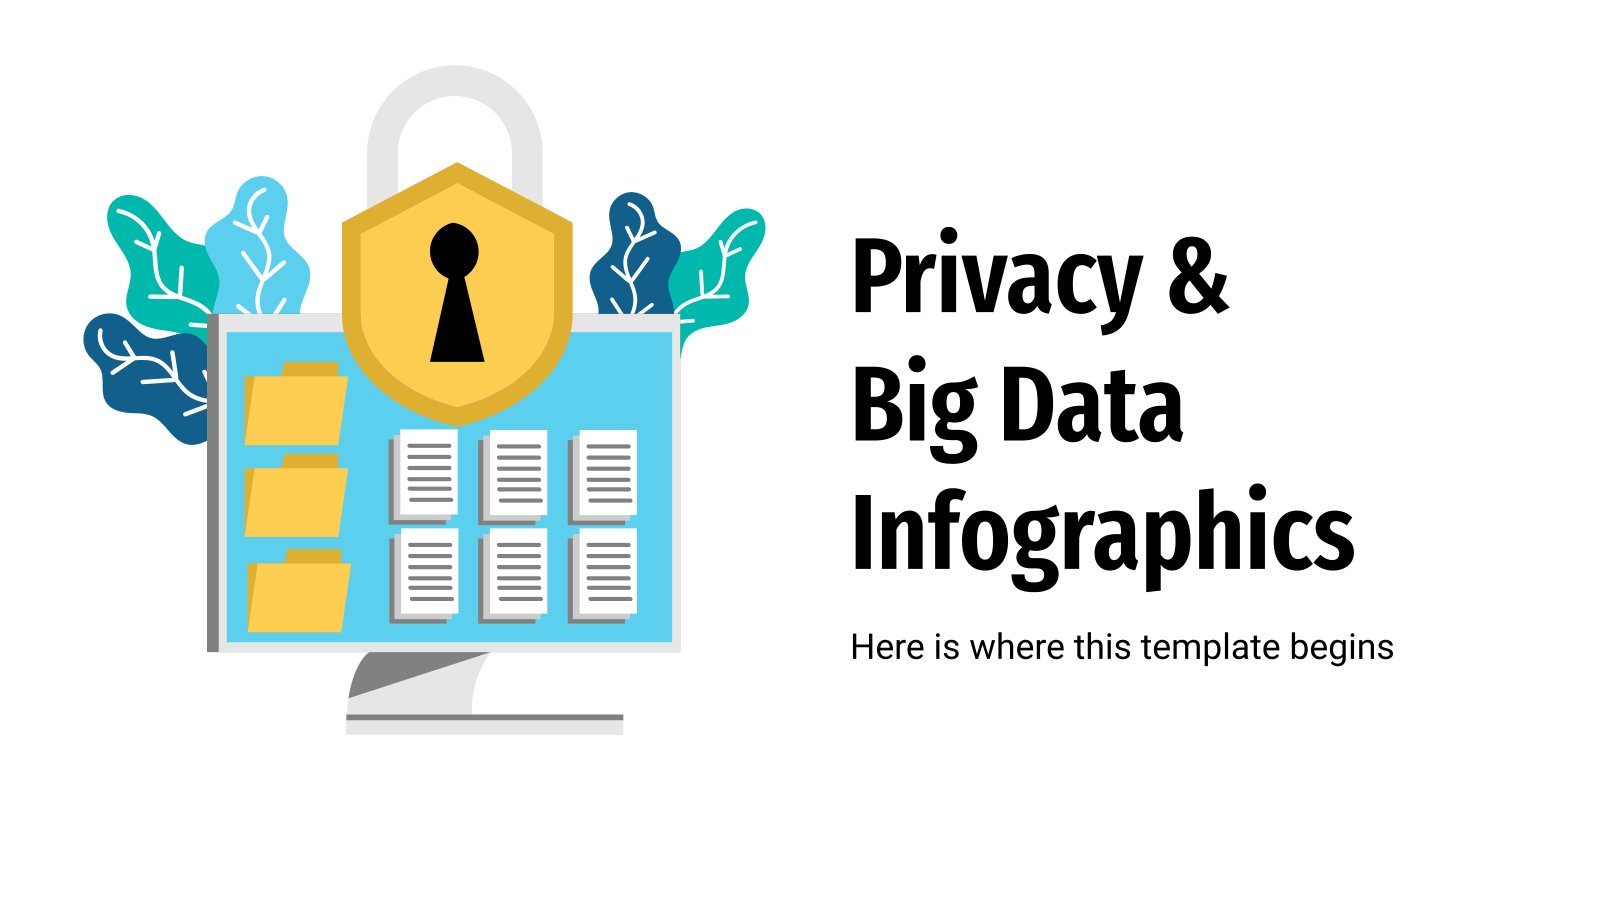
If you know what big data is you might want to also inform yourself about privacy. Some companies collect data from you and you don’t even realize it. Usually it’s just general content, and it’s only used to create trends and profiles that give you fitted advertising, but it’s always...

Download the "Cool and Slick Infographics" template for PowerPoint or Google Slides and discover the power of infographics. An infographic resource gives you the ability to showcase your content in a more visual way, which will make it easier for your audience to understand your topic. Slidesgo infographics like this...

When it comes to change management, that is, the transformation of an organization's processes or objectives, it is necessary to implement strategies so that these changes can be carried out successfully. Therefore, a structured change process is needed. To help you structure your changes, here are 32 infographics on change...

In most countries, women are paid less than men. The thing is: why hasn't this issue been fixed yet? Raise awareness about salary inequality between genders by adding these customizable infographics to your slideshows. We've included around 30 examples of compositions that you can use. Besides your usual pie charts...

Did you have a successful meeting with the Silver Waves Meeting template? What a joy to discover that you did! Well, we have a surprise for you: for the next one you can continue to be carried away by the elegance and professionalism of the silver waves, but you can...
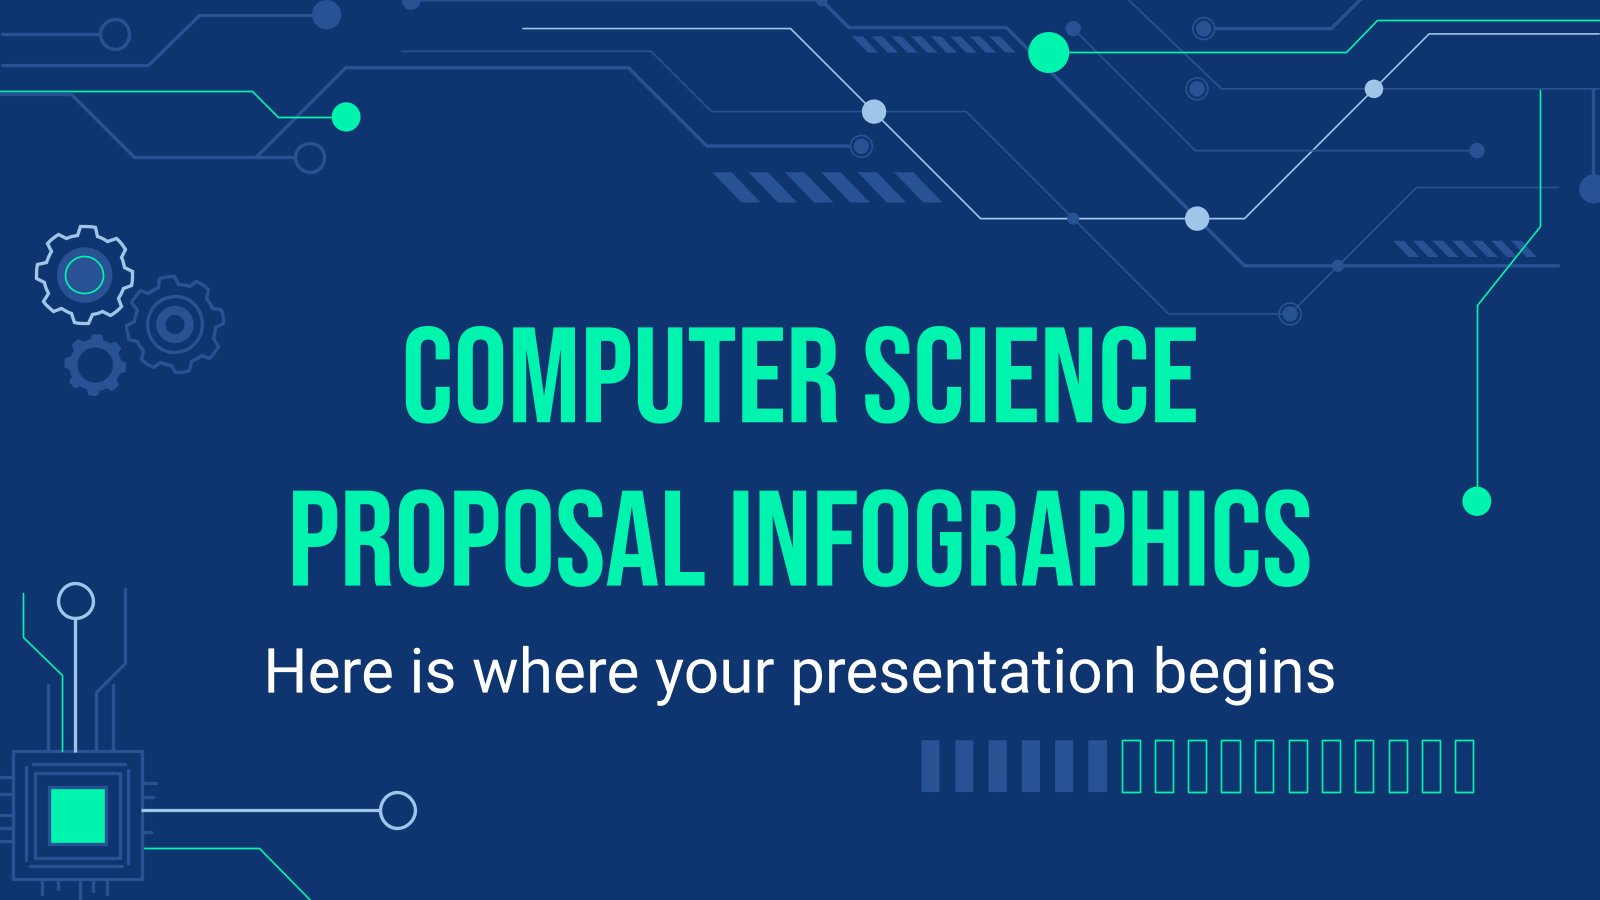
A computer science project. All right, there are many like these every day, but how to make yours stand out? Try presenting it with a great slideshow that looks and feels techie. But totally techie! In the case of these infographics, you'll get what you're looking for, plus maps, tables,...

Download the "AI Tech Infographics" template for PowerPoint or Google Slides to get the most out of infographics. Whether you want to organize your business budget in a table or schematically analyze your sales over the past year, this set of infographic resources will be of great help. Start using...

Forget about big blocks of text and say hello to infographics! These ones are suitable for topics on industrial production. Want to talk about product life-cycle management, or perhaps assembly lines? Gear up for success, because these designs are the key!
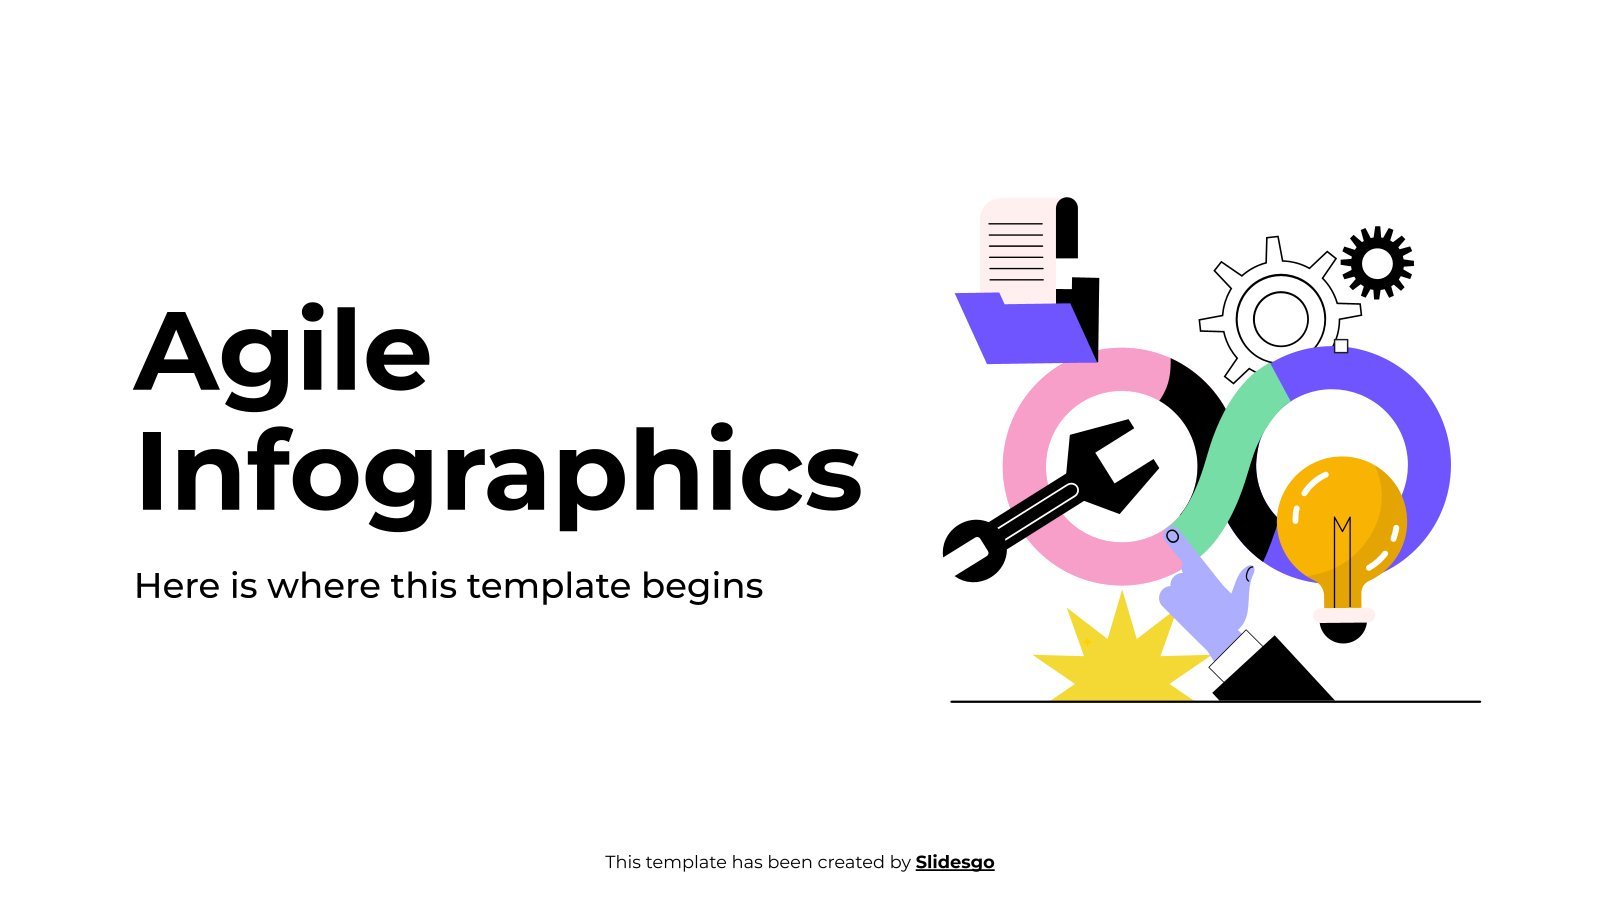
Download the Agile Infographics template for PowerPoint or Google Slides and discover the power of infographics. An infographic resource gives you the ability to showcase your content in a more visual way, which will make it easier for your audience to understand your topic. Slidesgo infographics like this set here...
Download the "Icons Infographics" template for PowerPoint or Google Slides and discover the power of infographics. An infographic resource gives you the ability to showcase your content in a more visual way, which will make it easier for your audience to understand your topic. Slidesgo infographics like this set here...

Do you want to give a report on how the market is faring and how it is segmented? Edit these infographics with your market share data, make comparisons, highlight your main competitors and so on. We’ve got circle charts, maps, bar graphs and tons of percentages.

Download the Movie Review App Infographics template for PowerPoint or Google Slides and discover the power of infographics. An infographic resource gives you the ability to showcase your content in a more visual way, which will make it easier for your audience to understand your topic. Slidesgo infographics like this...

Download the "Beer Infographics" template for PowerPoint or Google Slides and discover the power of infographics. An infographic resource gives you the ability to showcase your content in a more visual way, which will make it easier for your audience to understand your topic. Slidesgo infographics like this set here...

How’s your balance? Oh, sorry, we’re talking about finance here! Explain all your data on profit, losses, revenue and costs by using these editable infographics. Managing your company’s budget is now easier for all of you, since you can see how much money you’re earning and how much is being...