Business Infographics Presentation templates - Page 11
Thinking about new techniques to improve your company performance? Try our effective infographics for Google Slides and PowerPoint and present your data and results easily!


It seems that you like this template!

Register for free and start downloading now
Mergers and acquisitions are transactions involving the ownership of companies or other organizations. We have created a complete and useful template that contains more than 30 infographics designed in colors of the blue range, so that you can explain the concept of mergers and acquisitions in the business context in...

Download the Creative Checklist Infographics template for PowerPoint or Google Slides to get the most out of infographics. Whether you want to organize your business budget in a table or schematically analyze your sales over the past year, this set of infographic resources will be of great help. Start using...

Download the "Cycle Diagrams Theme for a Business Meeting" presentation for PowerPoint or Google Slides. Gone are the days of dreary, unproductive meetings. Check out this sophisticated solution that offers you an innovative approach to planning and implementing meetings! Detailed yet simplified, this template ensures everyone is on the same...
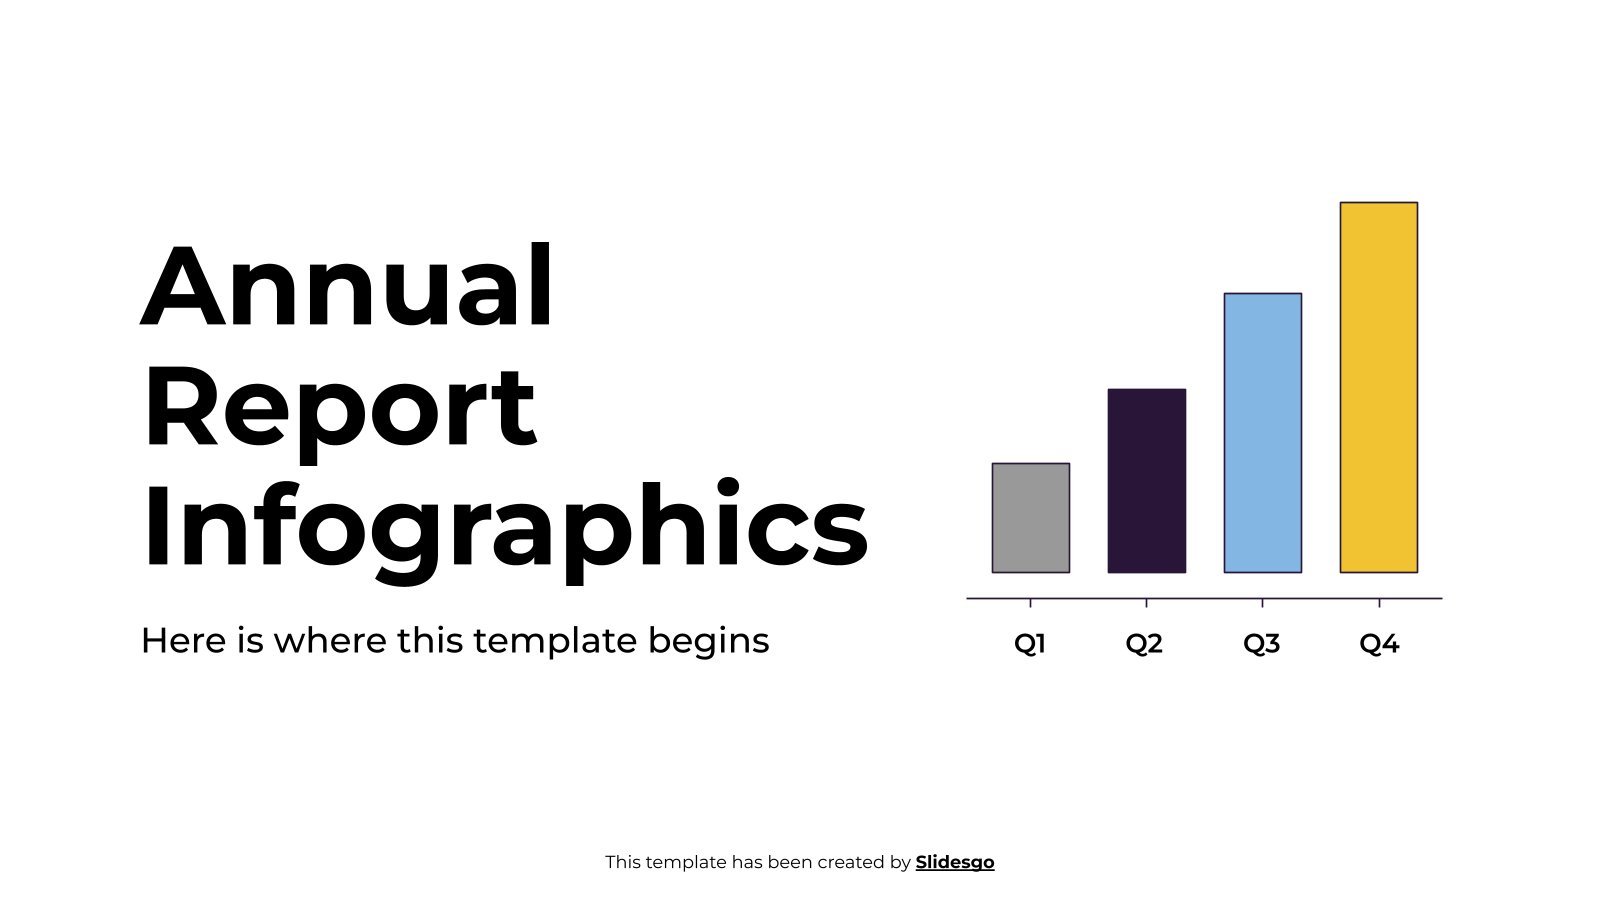
Download the "Annual Report Infographics" template for PowerPoint or Google Slides and discover the power of infographics. An infographic resource gives you the ability to showcase your content in a more visual way, which will make it easier for your audience to understand your topic. Slidesgo infographics like this set...

Data science consulting is an invaluable asset for companies looking to gain better insights from their data. This Data Science Consulting Infographics template for Google Slides and PowerPoint will help you present your service in an engaging, eye-catching way. Choose from different types of infographics, diagrams, and charts to get...

Download the Simple Business Plan Infographics template for PowerPoint or Google Slides and discover the power of infographics. An infographic resource gives you the ability to showcase your content in a more visual way, which will make it easier for your audience to understand your topic. Slidesgo infographics like this...

Some things have a beginning, an ending and some steps in between, and then they start again, following the same steps endlessly. That's how cycles are, and there are many ways of representing them in a visual manner. Get inspired by this design and see if it fits your needs!...

Businesses, organizations, groups or individuals, when gathered together in order to discuss what's the best course of action they have to take to achieve their goals, have to decide that road they'll follow. If you ask us, it's a simple thing: visit Slidesgo, then locate roadmap infographics like this one,...
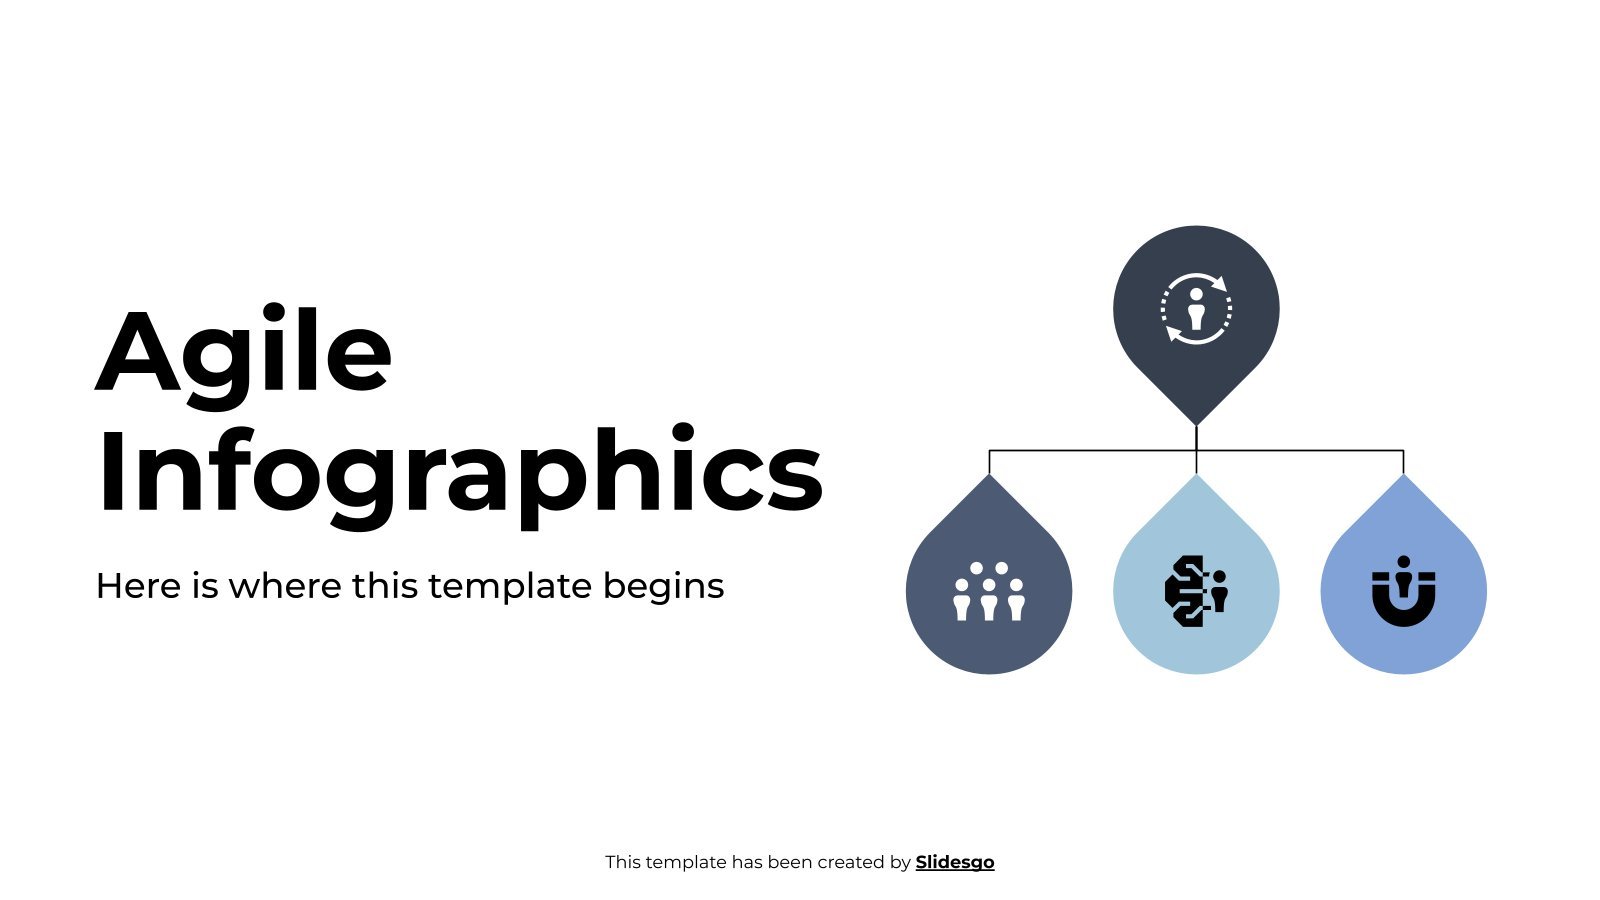
Download the Agile Infographics template for PowerPoint or Google Slides and discover the power of infographics. An infographic resource gives you the ability to showcase your content in a more visual way, which will make it easier for your audience to understand your topic. Slidesgo infographics like this set here...

Have you ever struggled to share a complex idea or process? Diagram infographics will make sure that doesn't happen again. These visually stunning and creative representations of information can help you break down even the most complicated concepts. Even better, they are editable and customizable to your needs, whether you're...

Flowcharts are representations of a process or a workflow, and we know that including one in your presentations can be a good idea. All the designs are in linear style, which means that shapes have no color fill, only stroke. Give them a try!

If you need infographics that depict the origin of a given event, these cause and effect diagrams are perfect for you. Use them to show details about your company, to present your marketing strategy or when preparing your classes. Download them now!

Present a SEO audit for a web page with these illustrative infographics focused on search engine optimisation. They will help you represent all the data that you have been collecting in a visual way and will give a clear image of whether your page is positioning good or not. They...

Download the "By The Numbers Infographics" template for PowerPoint or Google Slides and discover the power of infographics. An infographic resource gives you the ability to showcase your content in a more visual way, which will make it easier for your audience to understand your topic. Slidesgo infographics like this...

Download the Insurance Infographics template for PowerPoint or Google Slides and discover the power of infographics. An infographic resource gives you the ability to showcase your content in a more visual way, which will make it easier for your audience to understand your topic. Slidesgo infographics like this set here...
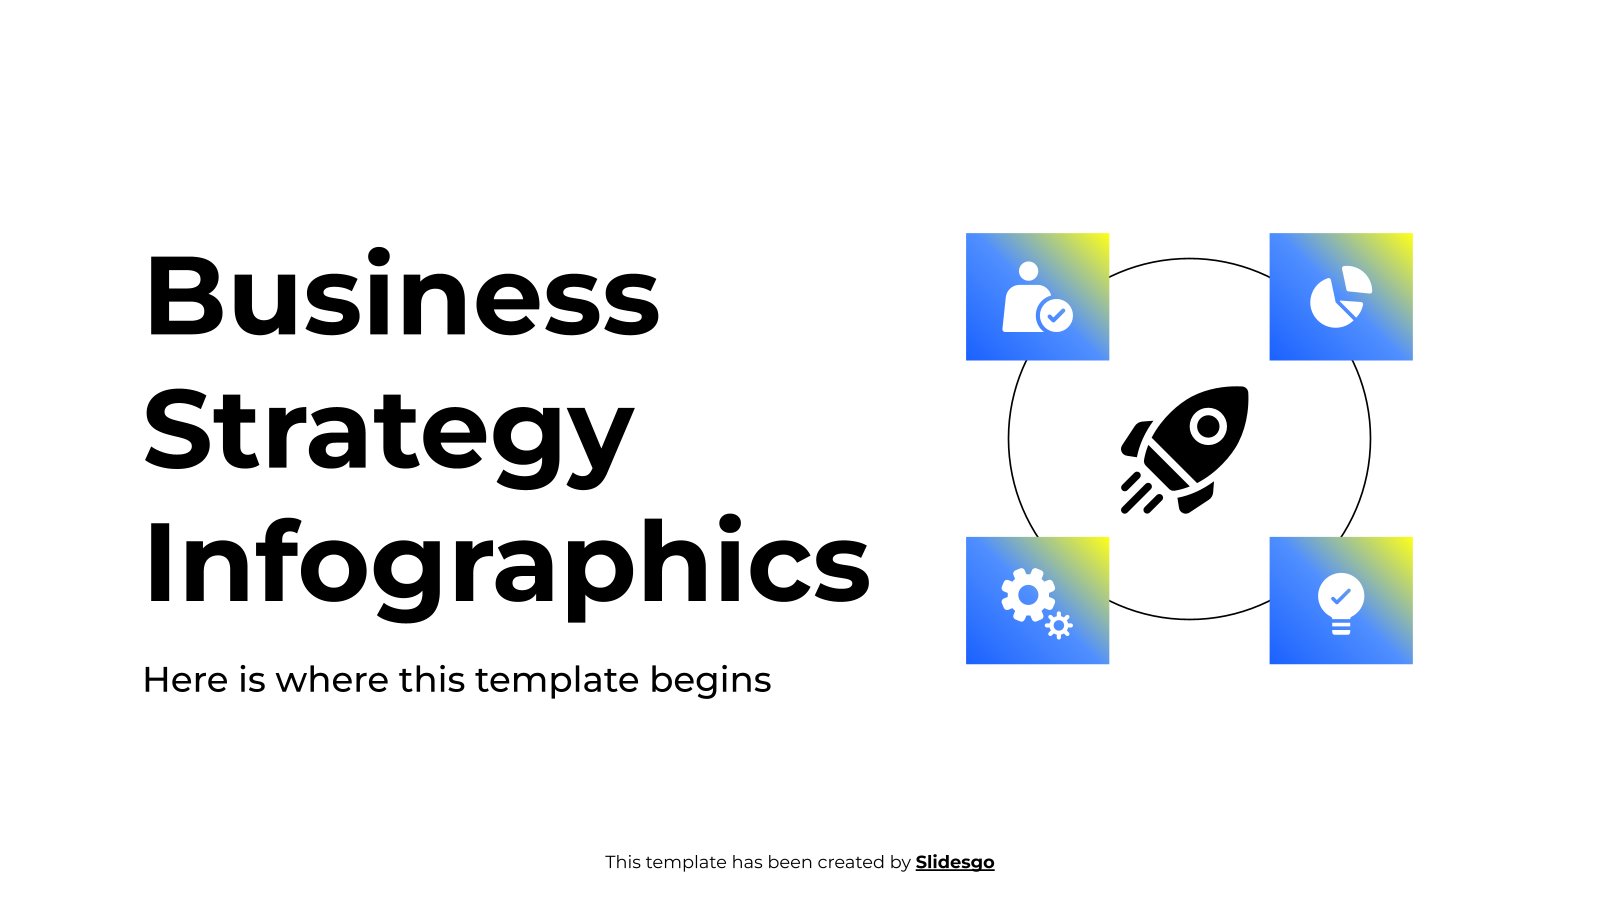
Download the "Professional Business Strategy Infographic" template for PowerPoint or Google Slides to get the most out of infographics. Whether you want to organize your business budget in a table or schematically analyze your sales over the past year, this set of infographic resources will be of great help. Start...

Does your project require a series of steps or alternating phases? Explain just that with these infographics and guide your audience so that they understand the process and how the goal is reached. You'll find mostly timelines here, with varying numbers of elements, representing each of these phases. The palette...
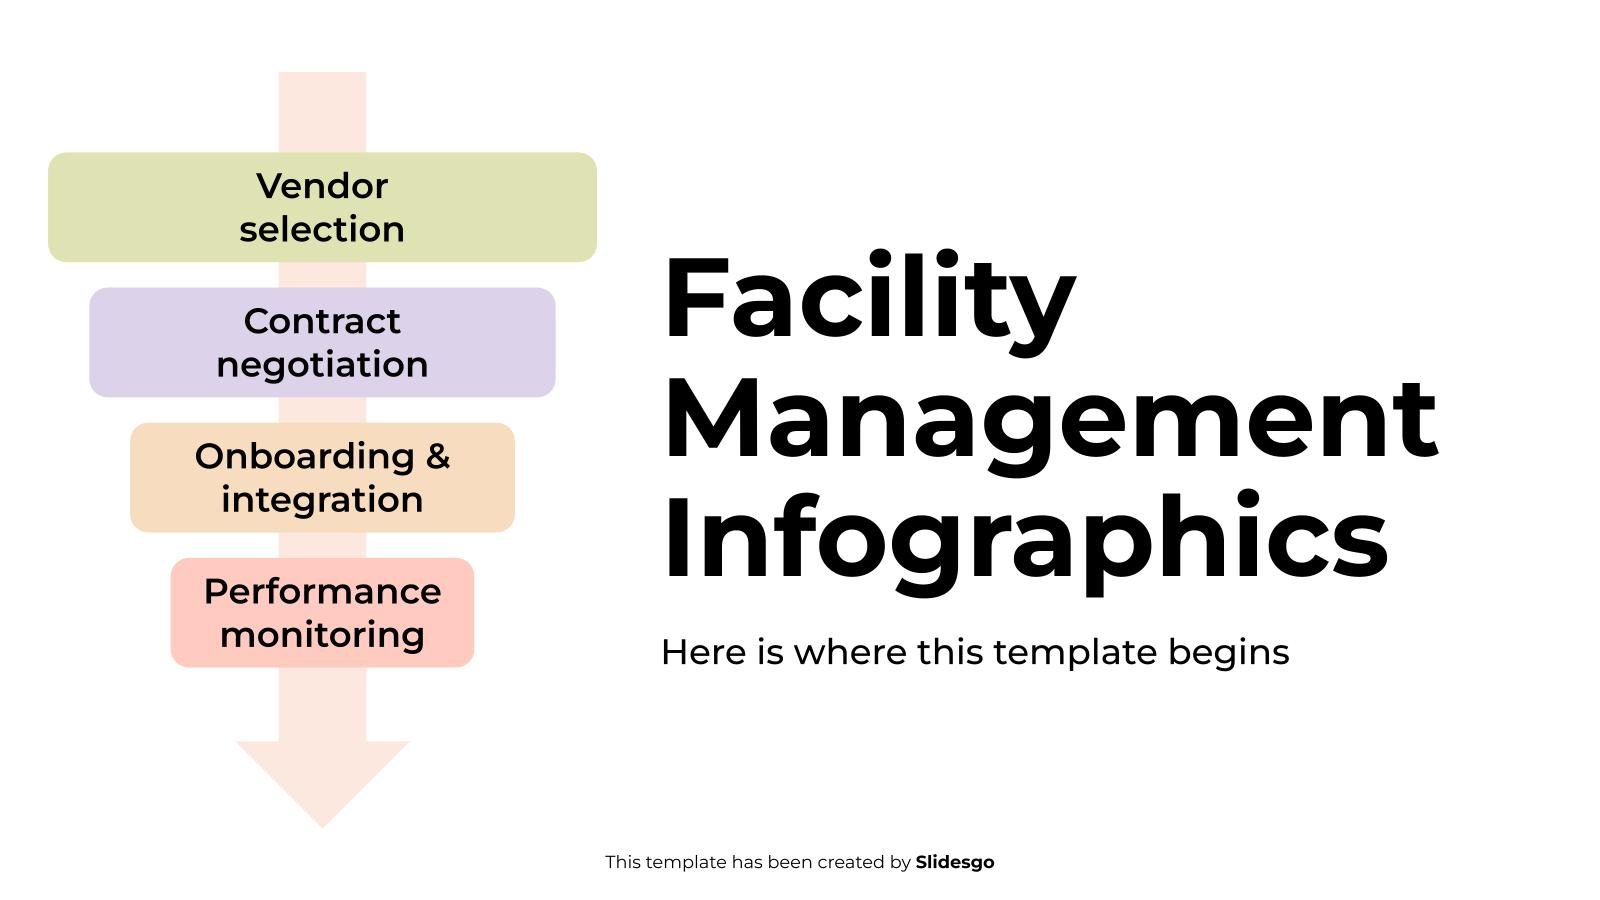
Download the Facility Management Infographics template for PowerPoint or Google Slides to get the most out of infographics. Whether you want to organize your business budget in a table or schematically analyze your sales over the past year, this set of infographic resources will be of great help. Start using...