Business Infographics Presentation templates - Page 10
Thinking about new techniques to improve your company performance? Try our effective infographics for Google Slides and PowerPoint and present your data and results easily!


It seems that you like this template!

Register for free and start downloading now
Download the "Boxing Gym Business Plan Infographics" template for PowerPoint or Google Slides and discover the power of infographics. An infographic resource gives you the ability to showcase your content in a more visual way, which will make it easier for your audience to understand your topic. Slidesgo infographics like...

The strategic analysis of the business environment is a very useful tool to really know the environment of a company or organization. To carry out this analysis, tools such as PESTEL or SWOT analysis are used. For this reason, we have designed some infographics for you to use in your...

The acronym "VRIO" is a business analysis framework and stands for "value, rarity, imitability and organization", four concepts that are assessed to determine whether a resource is, thus, valuable, rare, inimitable and exploitable for a company. These four concepts are the stars of these infographics, which come by default in...

Download the Business Meeting Infographics template for PowerPoint or Google Slides to get the most out of infographics. Whether you want to organize your business budget in a table or schematically analyze your sales over the past year, this set of infographic resources will be of great help. Start using...

Download the Process Infographics template for PowerPoint or Google Slides to get the most out of infographics. Whether you want to organize your business budget in a table or schematically analyze your sales over the past year, this set of infographic resources will be of great help. Start using infographics...
.png)
Download the Business Diagram Infographics template for PowerPoint or Google Slides to get the most out of infographics. Whether you want to organize your business budget in a table or schematically analyze your sales over the past year, this set of infographic resources will be of great help. Start using...

Download the Business Slides Infographics template for PowerPoint or Google Slides and discover the power of infographics. An infographic resource gives you the ability to showcase your content in a more visual way, which will make it easier for your audience to understand your topic. Slidesgo infographics like this set...

Download the Annual Report Infographics template for PowerPoint or Google Slides to get the most out of infographics. Whether you want to organize your business budget in a table or schematically analyze your sales over the past year, this set of infographic resources will be of great help. Start using...

Ready to use funnel infographics? They are perfect for business and marketing. Thanks to their conical shapes, you can depict the different steps to achieve your goal (e.g. a given client or lead.) Each section represents a percentage of loss for each stage of the process, that’s why they are...

Download the "Cycle Diagrams Theme for Business" presentation for PowerPoint or Google Slides. The world of business encompasses a lot of things! From reports to customer profiles, from brainstorming sessions to sales—there's always something to do or something to analyze. This customizable design, available for Google Slides and PowerPoint, is...
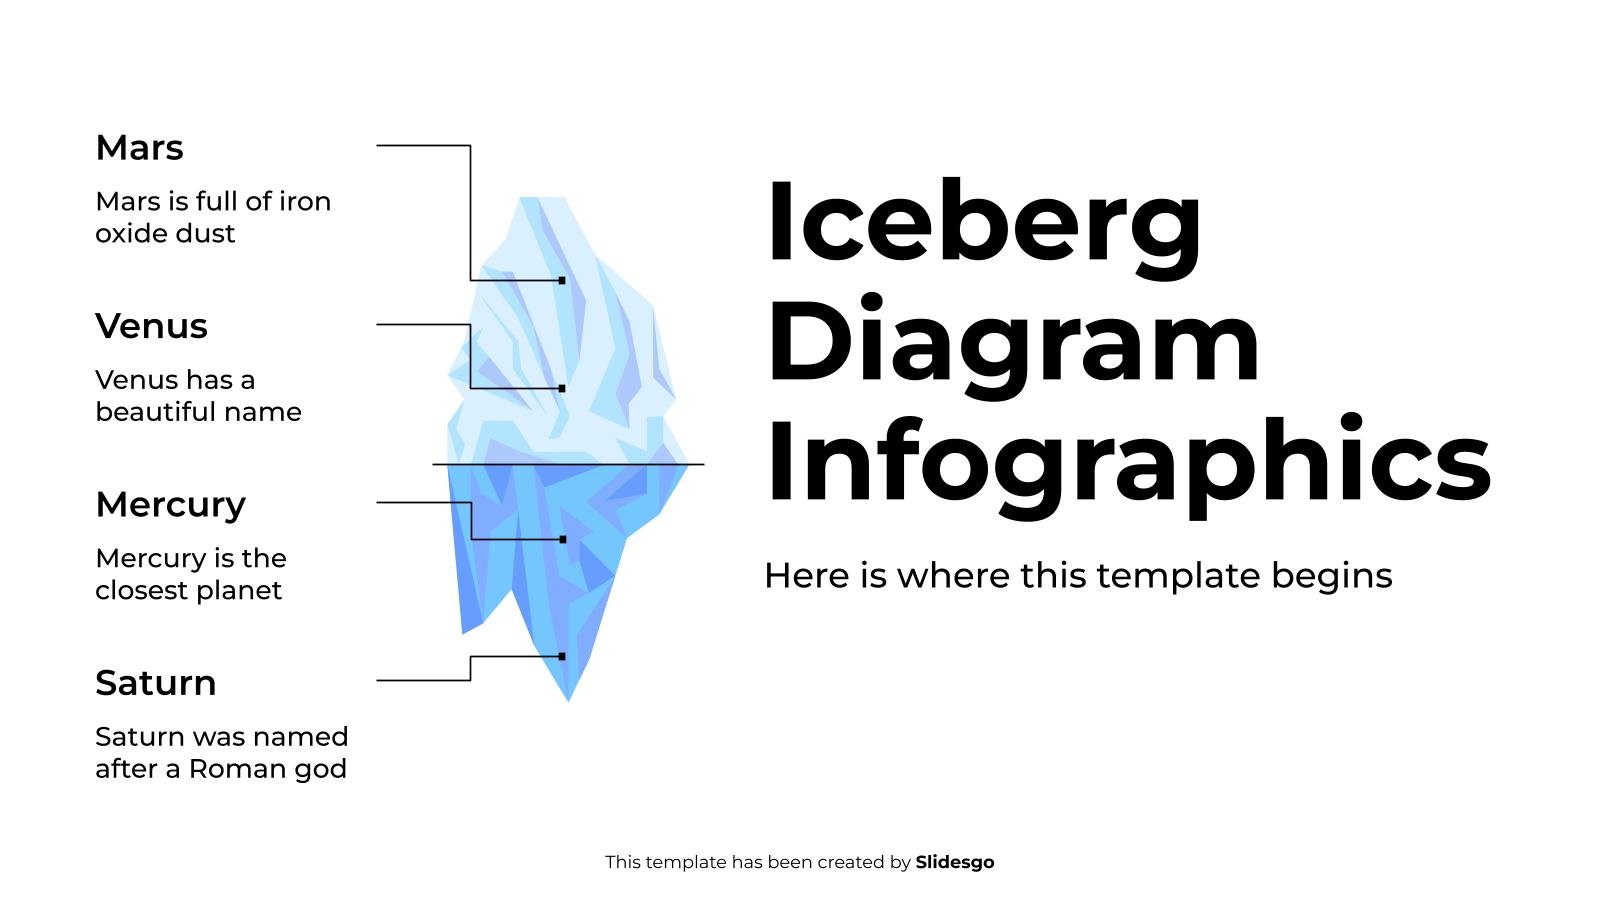
Download the Iceberg Diagram Infographics template for PowerPoint or Google Slides to get the most out of infographics. Whether you want to organize your business budget in a table or schematically analyze your sales over the past year, this set of infographic resources will be of great help. Start using...

Download the List Infographics template for PowerPoint or Google Slides to get the most out of infographics. Whether you want to organize your business budget in a table or schematically analyze your sales over the past year, this set of infographic resources will be of great help. Start using infographics...
Download the "Cycle Diagrams Theme for Business" presentation for PowerPoint or Google Slides. The world of business encompasses a lot of things! From reports to customer profiles, from brainstorming sessions to sales—there's always something to do or something to analyze. This customizable design, available for Google Slides and PowerPoint, is...

Download the Checklist Infographics template for PowerPoint or Google Slides to get the most out of infographics. Whether you want to organize your business budget in a table or schematically analyze your sales over the past year, this set of infographic resources will be of great help. Start using infographics...

Download the "Business Infographics" template for PowerPoint or Google Slides to get the most out of infographics. Whether you want to organize your business budget in a table or schematically analyze your sales over the past year, this set of infographic resources will be of great help. Start using infographics...

Download the Supermarket Business Plan Infographics template for PowerPoint or Google Slides and discover the power of infographics. An infographic resource gives you the ability to showcase your content in a more visual way, which will make it easier for your audience to understand your topic. Slidesgo infographics like this...

Download the Business Model infographic template for PowerPoint or Google Slides to get the most out of infographics. Whether you want to organize your business budget in a table or schematically analyze your sales over the past year, this set of infographic resources will be of great help. Start using...

Download the Pricing Table Infographics template for PowerPoint or Google Slides to get the most out of infographics. Whether you want to organize your business budget in a table or schematically analyze your sales over the past year, this set of infographic resources will be of great help. Start using...