Statistics Presentation templates
Everyone uses percentages to make their statements sound more credible; 74% of the population knows that! These Google Slides themes and PowerPoint templates will allow you to talk or teach about statistics, the branch of math that concerns data collection, interpretation and representation.


It seems that you like this template!

Register for free and start downloading now
Business, a fast-paced world where "yesterday" is simply "a lot of time ago". Harnessing the power of data has become a game-changer. From analyzing customer behavior to making informed decisions, data analytics has emerged as a crucial strategy for organizations across industries. But fear not, because we have a toolkit...
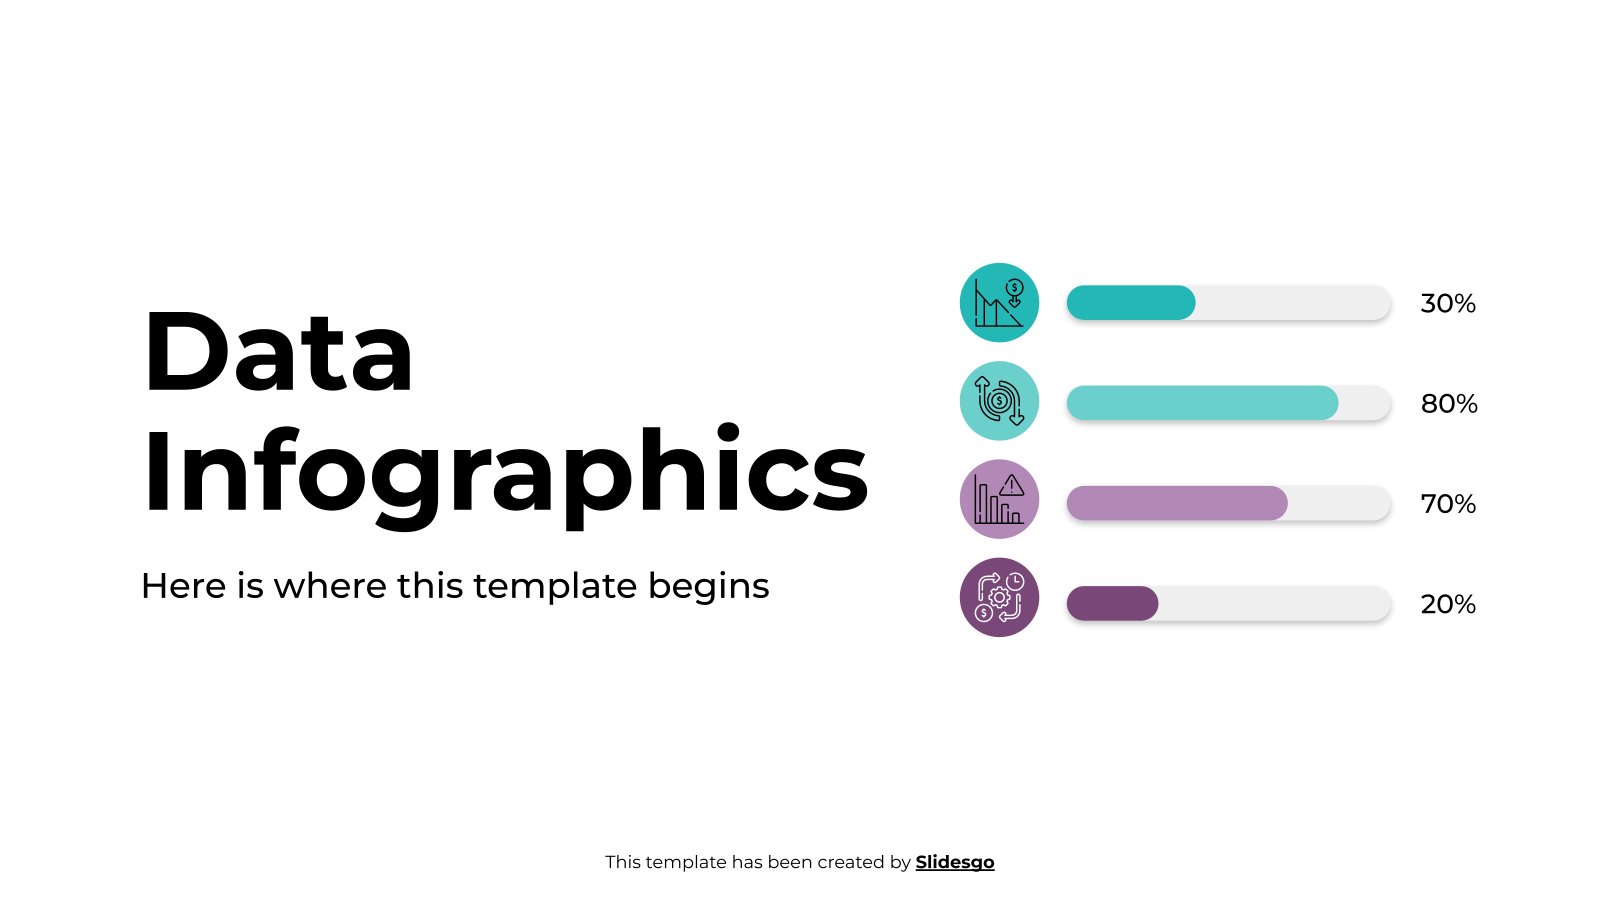

Download the Data Infographics template for PowerPoint or Google Slides to get the most out of infographics. Whether you want to organize your business budget in a table or schematically analyze your sales over the past year, this set of infographic resources will be of great help. Start using infographics...


Download the "Biostatistics - Bachelor of Science in Human Biology" presentation for PowerPoint or Google Slides. As university curricula increasingly incorporate digital tools and platforms, this template has been designed to integrate with presentation software, online learning management systems, or referencing software, enhancing the overall efficiency and effectiveness of student...


Download the "Clinical Trials - Master of Science in Biostatistics" presentation for PowerPoint or Google Slides. As university curricula increasingly incorporate digital tools and platforms, this template has been designed to integrate with presentation software, online learning management systems, or referencing software, enhancing the overall efficiency and effectiveness of student...


Teaching your elementary students about measurement and data is an essential math lesson that will serve them for a lifetime. To make your work easier, we propose this template in red and white, with which you can introduce the subject, explain the operations and propose multiple choice, true and false,...


The impact of this presentation template on an audience will be very high for two reasons. First of all, because of its design. It offers a brutalist style, which seems to rebel against all the rules of graphic design. On the slides, you will find risky compositions, following a collage...


There are two main branches in statistics, which are descriptive statistics and inferential statistics. The former focuses on providing data (for example, quantitative) about a specific sample. Think of three soccer players and the percentage of goals scored from a free kick. That would be an example! If you've gathered...
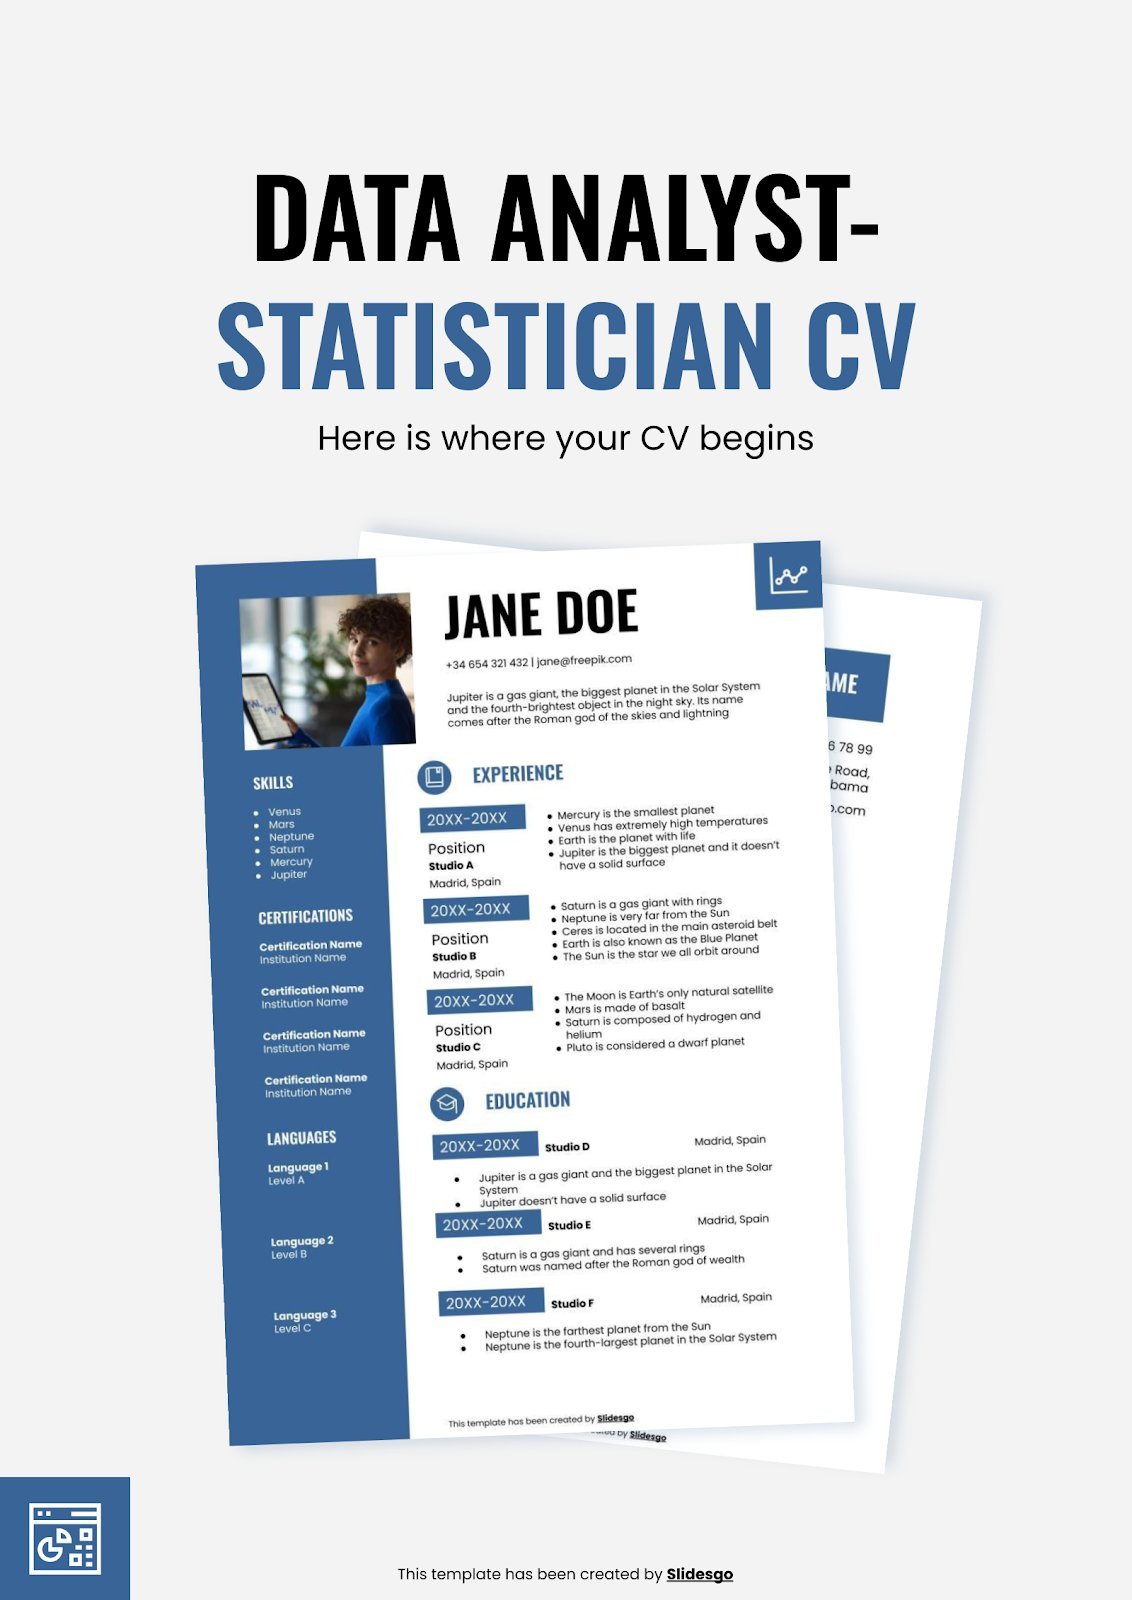

In this era, the amount of data that some companies can gather is... maybe too big to handle. They need the help of data analysts to find out what chunks of data are the most relevant and important for the goals that are being pursued. How to be certain that...