Search results for statistics
Here you have 101 templates based on your search of statistics. Enjoy them!

It seems that you like this template!

Register for free and start downloading now
Business, a fast-paced world where "yesterday" is simply "a lot of time ago". Harnessing the power of data has become a game-changer. From analyzing customer behavior to making informed decisions, data analytics has emerged as a crucial strategy for organizations across industries. But fear not, because we have a toolkit...
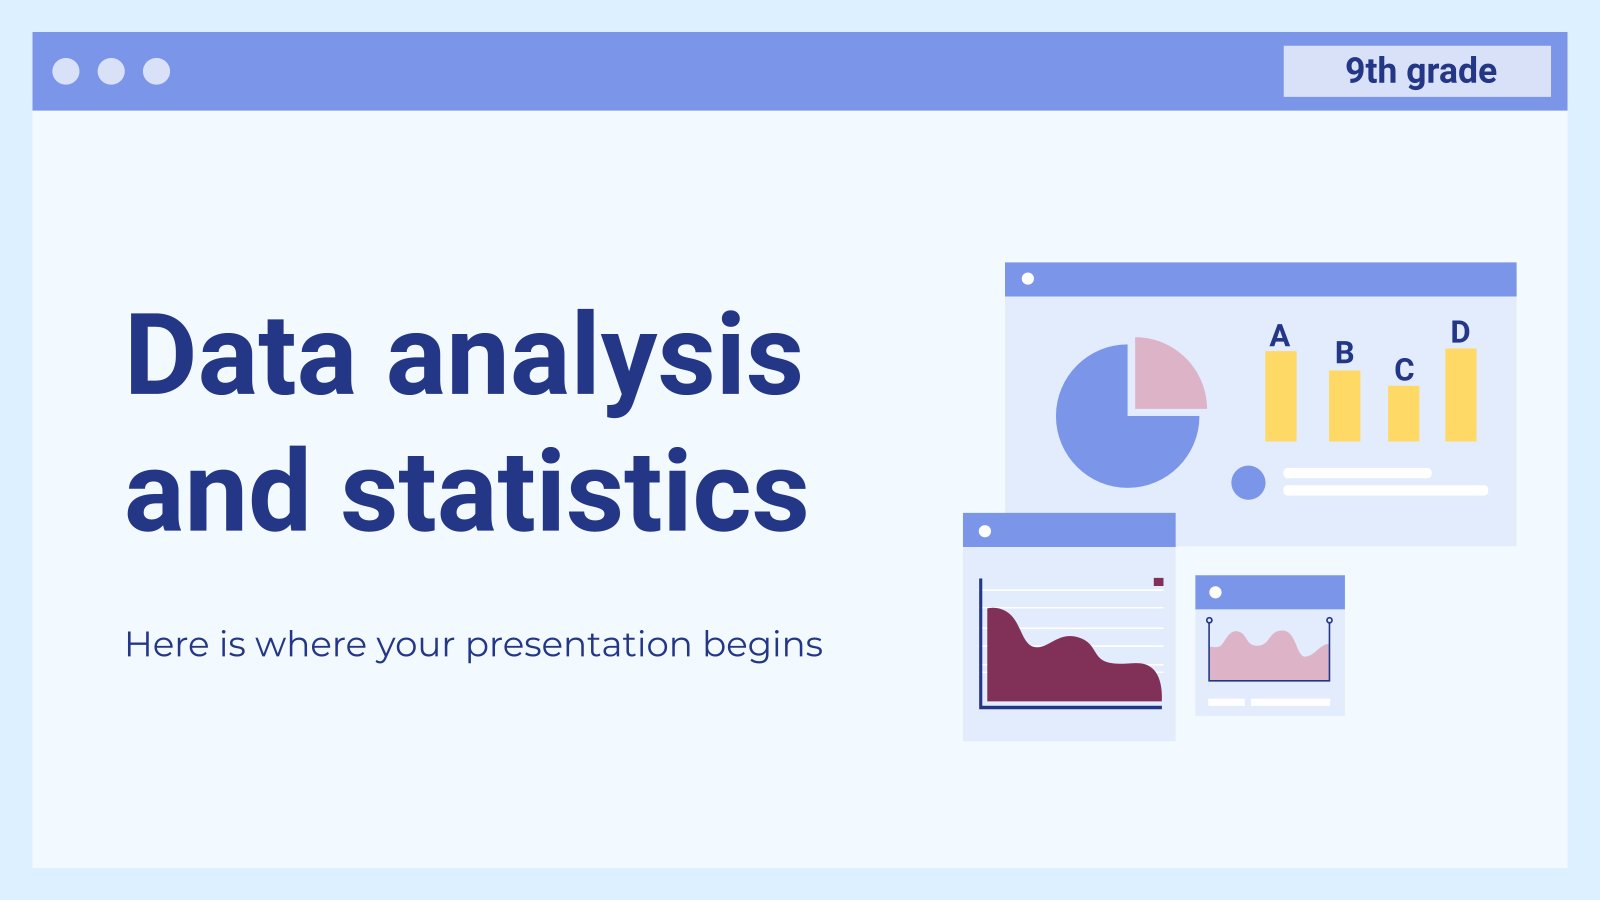
Download the "Data Analysis and Statistics - 9th Grade" presentation for PowerPoint or Google Slides. High school students are approaching adulthood, and therefore, this template’s design reflects the mature nature of their education. Customize the well-defined sections, integrate multimedia and interactive elements and allow space for research or group projects—the...
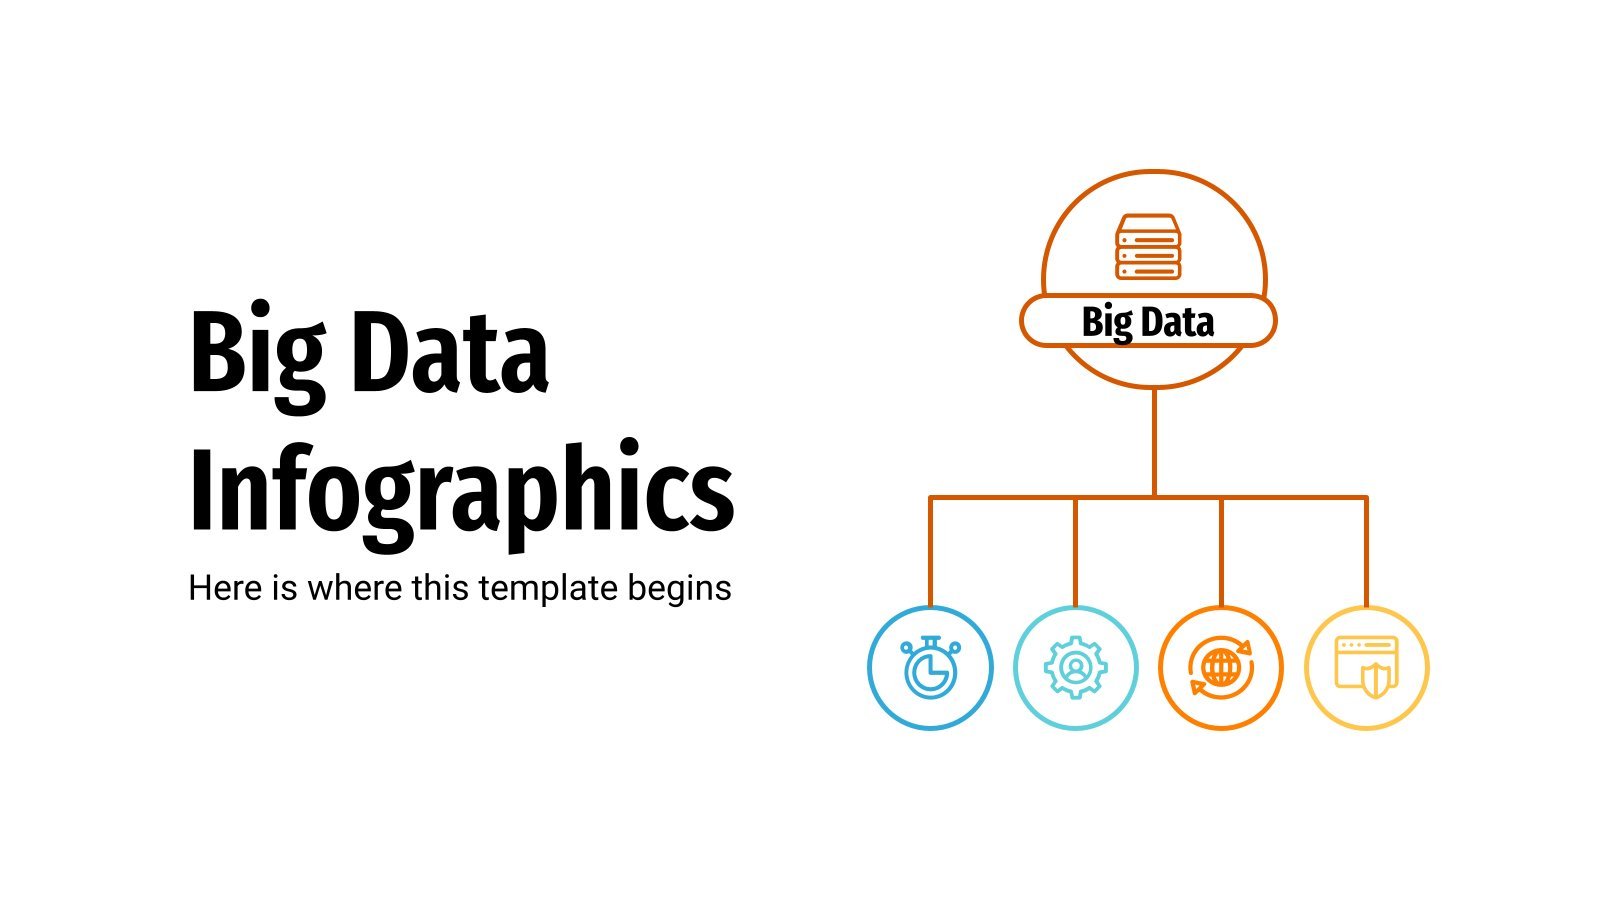
Explore and analyse large amounts of information thanks to these Big Data infographics. Create new commercial services, use them for marketing purposes or for research, no matter the topic. We have added charts, reports, gears, pie charts, text blocks, circle and cycle diagrams, pyramids and banners in different styles, such...

Share your skills as a data analyst with this creative template for resumes. With the modern slides of this presentation, you can give your experience, skills and projects a whole new dimension and captivate the attention of new employers or potential clients. The resources we have included are completely editable...
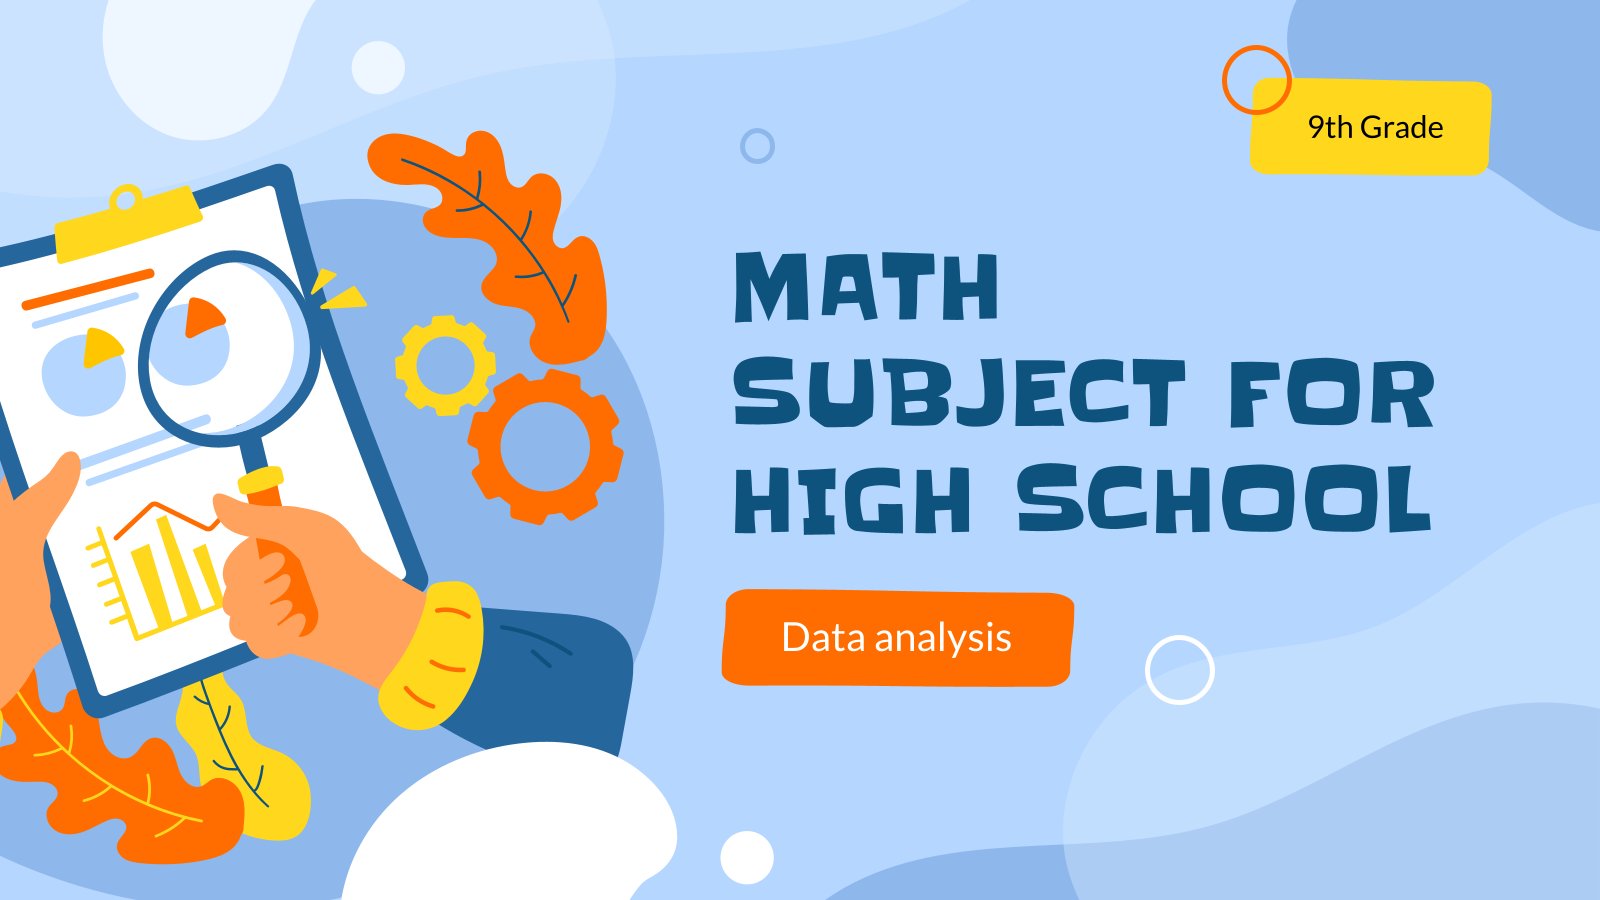
Analyzing data is very helpful for middle schoolers! They will get it at the very first lesson if you use this template in your maths class. Visual representations of data, like graphs, are very helpful to understand statistics, deviation, trends… and, since math has many variables, so does our design:...

Download the "Statistics and Probability - Math - 7th Grade" presentation for PowerPoint or Google Slides. If you’re looking for a way to motivate and engage students who are undergoing significant physical, social, and emotional development, then you can’t go wrong with an educational template designed for Middle School by...

Download the Statistics Infographics template for PowerPoint or Google Slides to get the most out of infographics. Whether you want to organize your business budget in a table or schematically analyze your sales over the past year, this set of infographic resources will be of great help. Start using infographics...

Exploring the world of probability and statistics can be challenging, but this Google Slides & PowerPoint template is here to simplify it. The design is simple, bold, and creative, predominantly featuring a professional shade of gray. Perfectly suited for educators or researchers, it's brimming with clean graphics, easy-to-understand infographics, and...
Analyzing statistical data is getting more and more important in a business. If you work as a data analyst, why don’t you share the information with everyone in the company? Here, we designed this very simple pink and orange colored template just for you! There are also various resources like...

Download the Data Analysis Workshop presentation for PowerPoint or Google Slides. If you are planning your next workshop and looking for ways to make it memorable for your audience, don’t go anywhere. Because this creative template is just what you need! With its visually stunning design, you can provide your...

Download the Business Management and Analytics Thesis Defense presentation for PowerPoint or Google Slides. Congratulations, you have finally finished your research and made it to the end of your thesis! But now comes the big moment: the thesis defense. You want to make sure you showcase your research in the...

Download the Dashboard Infographics template for PowerPoint or Google Slides and discover the power of infographics. An infographic resource gives you the ability to showcase your content in a more visual way, which will make it easier for your audience to understand your topic. Slidesgo infographics like this set here...

Interested in getting people to pursue a master's degree in Biostatistics? This modern and professional template is the perfect way to showcase your program. With its blue and white combination, it conveys a sense of trustworthiness and reliability. It contains all the essential information regarding the Biostatistics program, such as...

Download the "Longitudinal Data Analysis - Master of Science in Biostatistics" presentation for PowerPoint or Google Slides. As university curricula increasingly incorporate digital tools and platforms, this template has been designed to integrate with presentation software, online learning management systems, or referencing software, enhancing the overall efficiency and effectiveness of...

One important part of math is statistics and probability. Do your students know about this lesson? It’s essential they master all about statistics, so what better way to introduce them to these concepts than a dynamic template specially designed for this reason! Create the most engaging lesson with creative resources....

Give some information about your Center for Health Statistics with this abstract presentation. It includes transparencies and sections to provide some details about your center, patient care or accomplishments. Support your data with maps, graphs and timelines.

Download the "Statistics and probability - Math - 6th Grade" presentation for PowerPoint or Google Slides and easily edit it to fit your own lesson plan! Designed specifically for elementary school education, this eye-catching design features engaging graphics and age-appropriate fonts; elements that capture the students' attention and make the...

Demographic infographics are useful when you want to share the results of some analyses related to people: percentages related to the age, hobbies, location and the like of a group of people. Use them for business or marketing purposes! We have included maps, pie charts, bar graphs, diagrams of people...