Infographics Presentation templates - Page 29
Discover our engaging Google Slides and PowerPoint slides full of infographics to present your information or data clearly and quickly!

It seems that you like this template!

Register for free and start downloading now
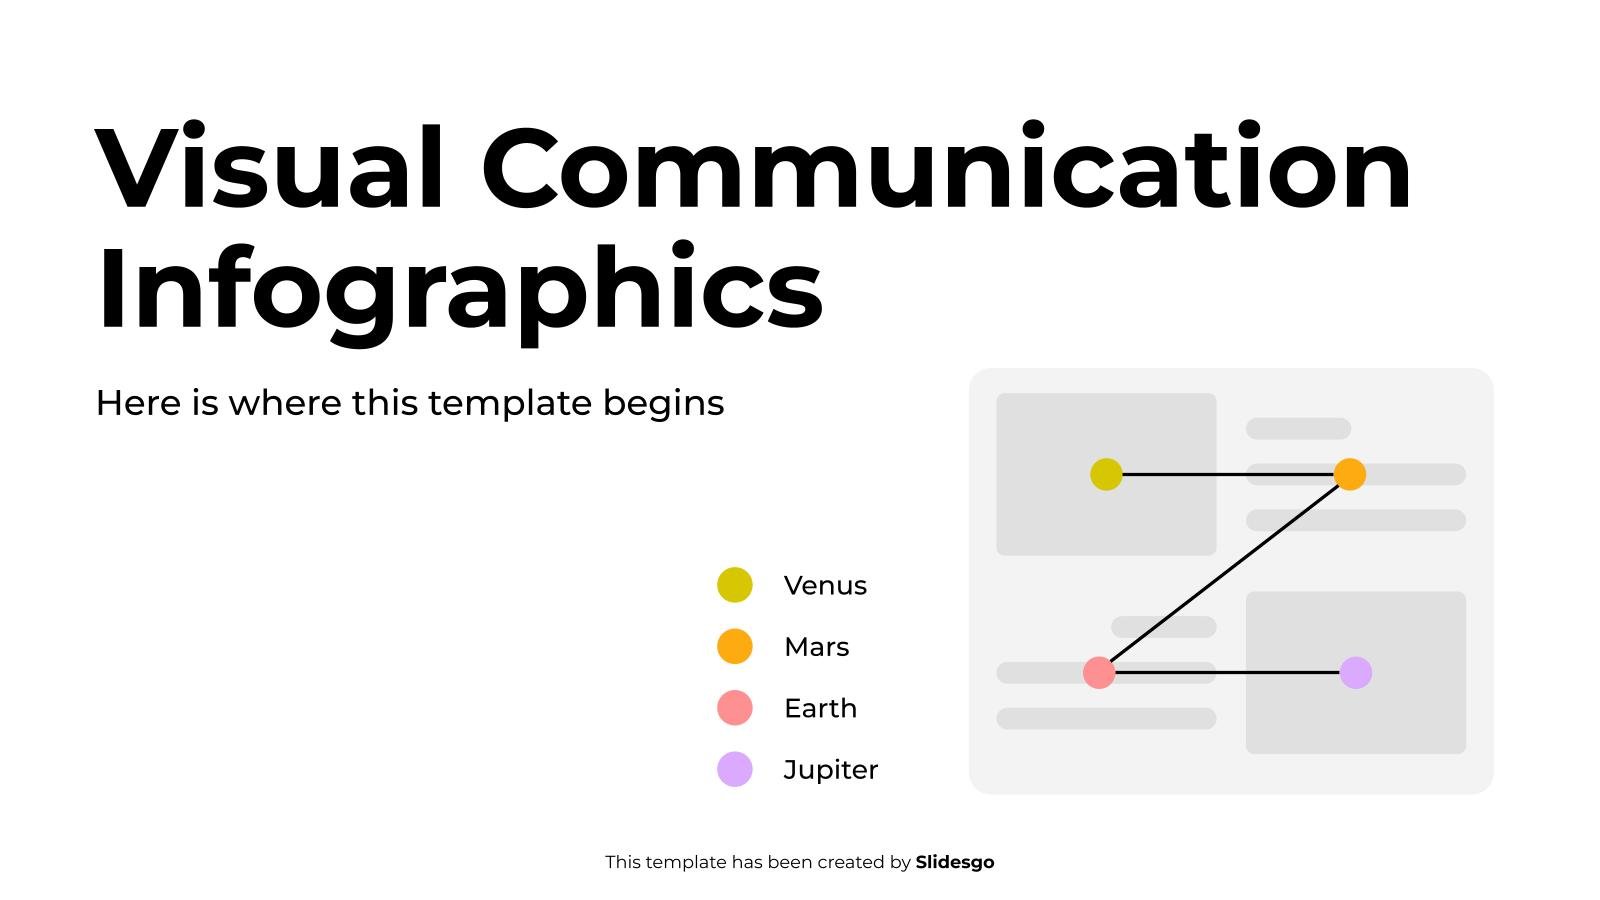
Download the Visual Communication Infographics template for PowerPoint or Google Slides to get the most out of infographics. Whether you want to organize your business budget in a table or schematically analyze your sales over the past year, this set of infographic resources will be of great help. Start using...

Those involved in the medical industry will probably know how important medical transplants are, as thanks to them countless lives have been saved. It's vital to have a clear and informative understanding of this topic, so we've decided to create a series of editable infographic designs for all kinds of...
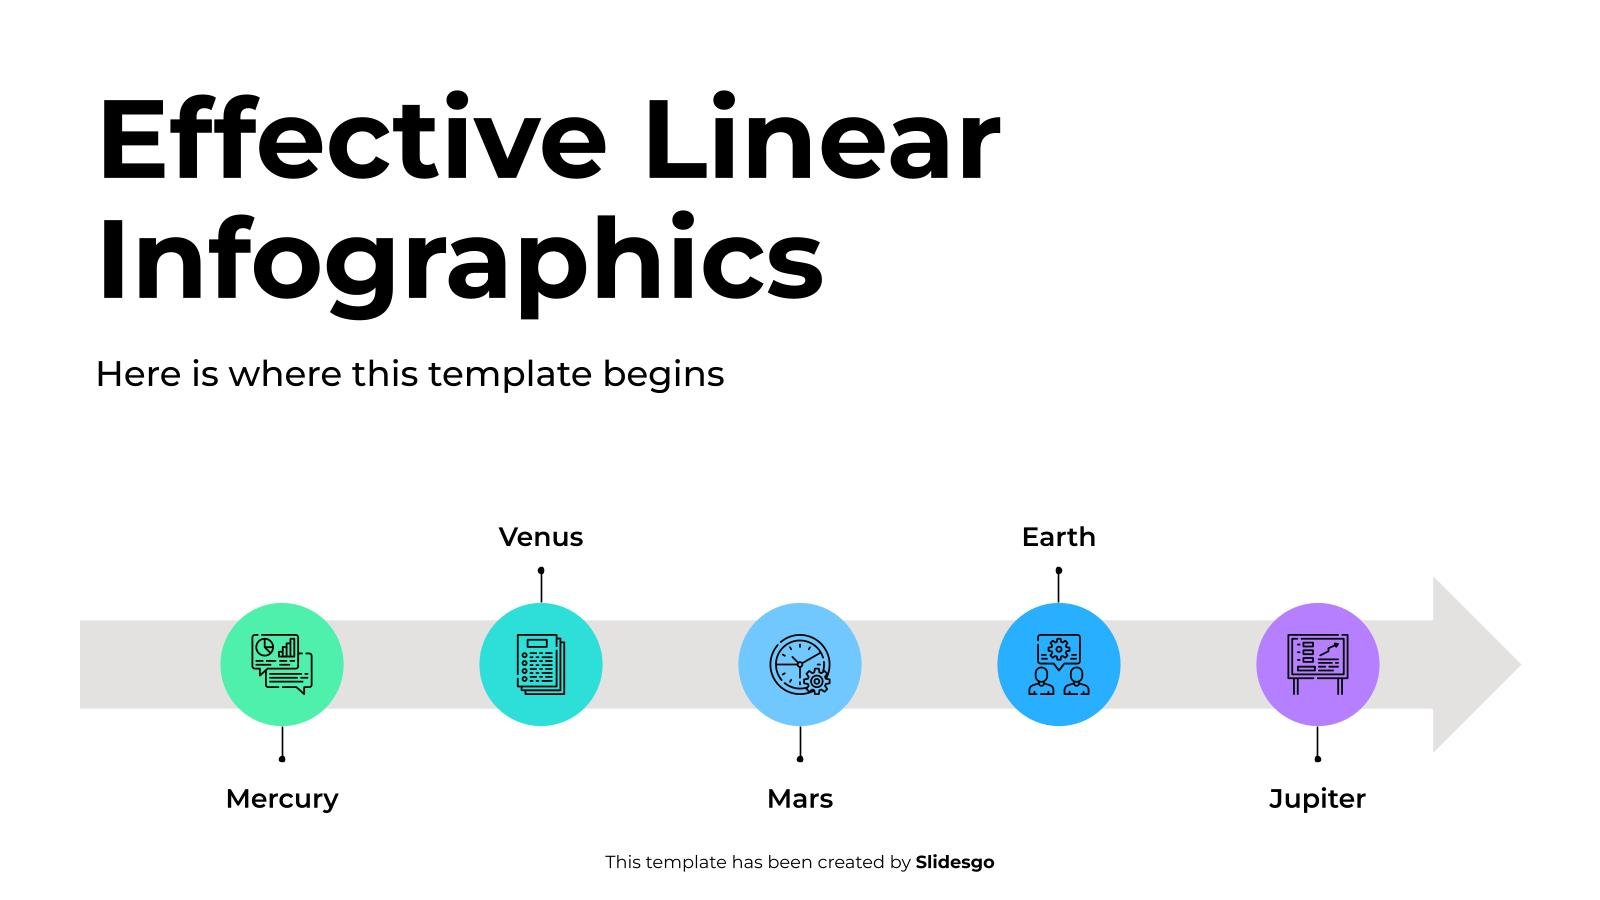
Download the Effective Linear Infographics presentation for PowerPoint or Google Slides. Conveying your business plan accurately and effectively is the cornerstone of any successful venture. This template allows you to pinpoint essential elements of your operation while your audience will appreciate the clear and concise presentation, eliminating any potential misunderstandings....
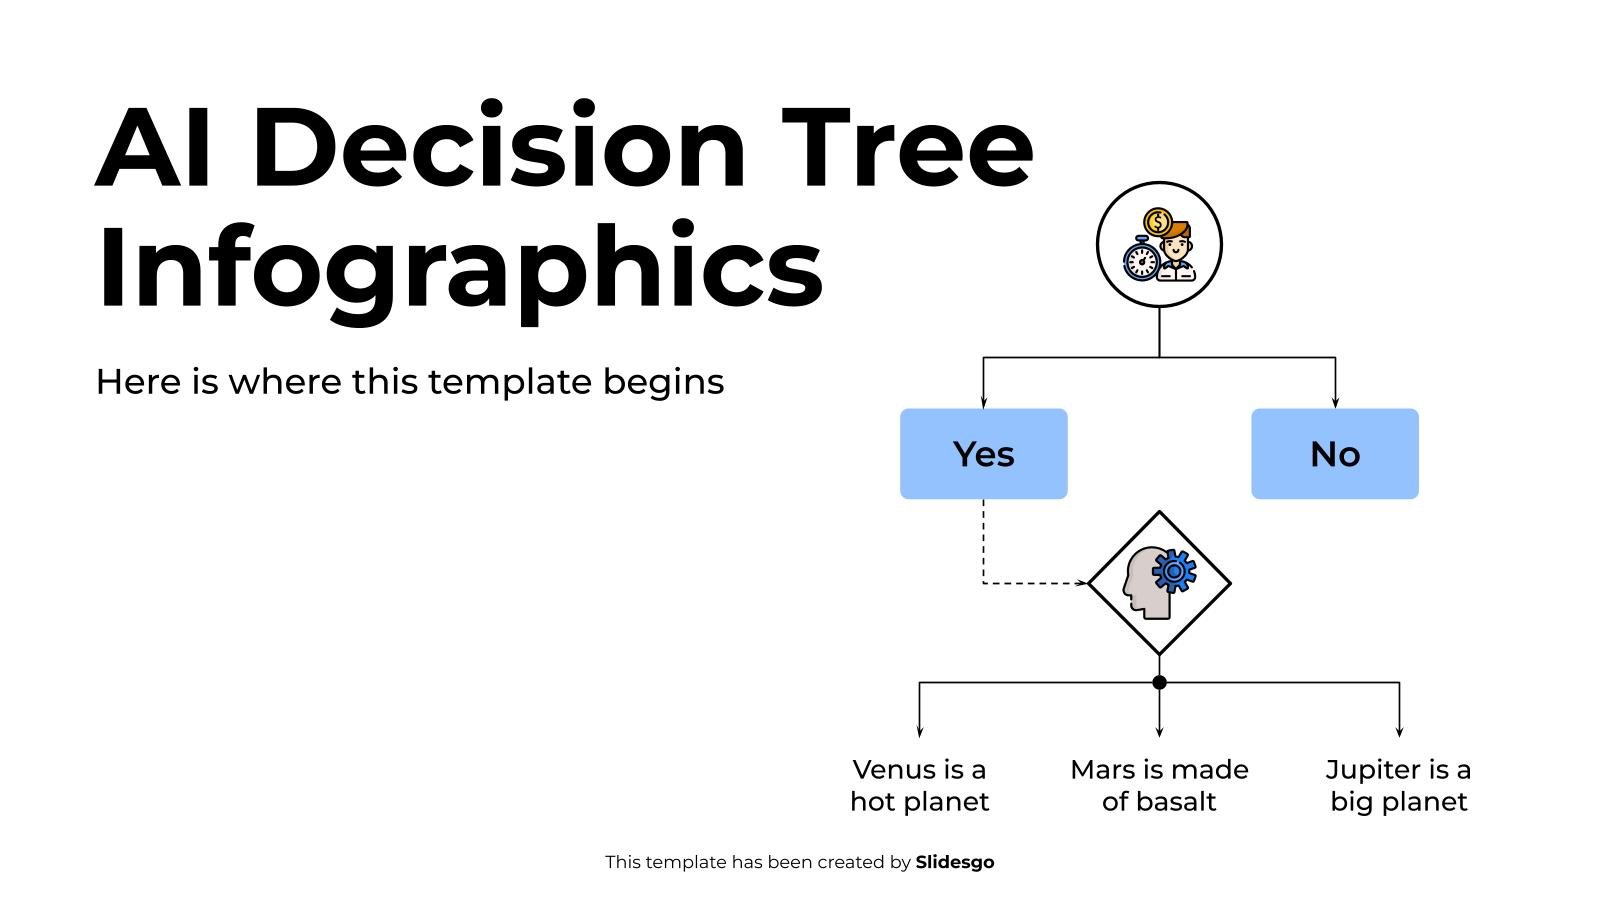
Download the AI Decision Tree Infographics template for PowerPoint or Google Slides to get the most out of infographics. Whether you want to organize your business budget in a table or schematically analyze your sales over the past year, this set of infographic resources will be of great help. Start...
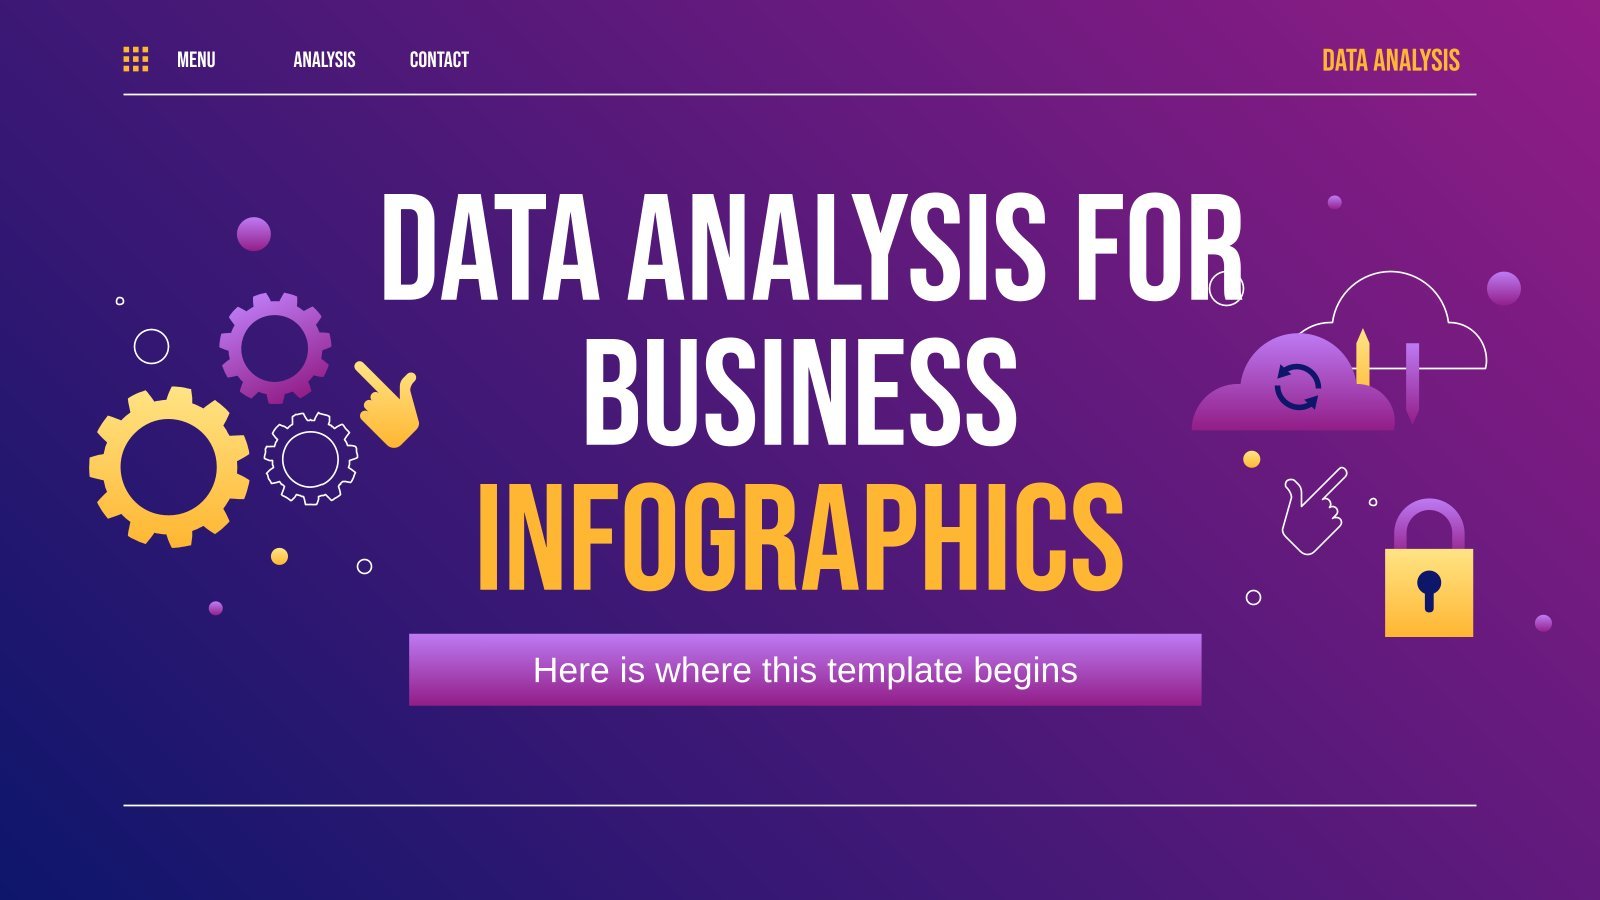
Introducing the new set of bright purple infographics that's here to help you up your data analysis presentation game! These infographics offer a visually comprehensible way to package your analysis results that can be easily grasped by everyone in your audience. With fully editable extra resources, you can customize each...

Download the "Art Infographics" template for PowerPoint or Google Slides and discover the power of infographics. An infographic resource gives you the ability to showcase your content in a more visual way, which will make it easier for your audience to understand your topic. Slidesgo infographics like this set here...

As a project management tool, these RAID infographics can help you cover multiple concepts at a glance in your presentation. Of course, all our designs, from graphs to Gantt charts, contain four elements: Risks, Assumptions, Issues and Dependencies. Some of them will surprise you, like the one with a 3D...

You passed your last test, but you want more. That A+ that is so elusive... With this template, you can share with other people the best strategies regarding tests. It's an assortment of editable infographics that offers different ways of explaining the best test-taking strategies. Featuring funny and unique slides,...

Is it time to check out how well a project is faring so far? To make it visually appealing, try our infographics. Your reports will look amazing with these designs, which make use of traffic lights or status bars to represent the different stages and their current status. Everything is...

Collaboration and cross-functional teams: that is what the Agile practices are about. Help your team better understand this concept by using our infographics, designed with variety and usability in mind. They are quite colorful, and you’ve got many styles to choose from: flat, fill, isometric or hand-drawn.

Download the KPI Finances Infographics template for PowerPoint or Google Slides to get the most out of infographics. Whether you want to organize your business budget in a table or schematically analyze your sales over the past year, this set of infographic resources will be of great help. Start using...

It's the time to explain to the world what the most important strategies companies are using in today's business world! We have designed around thirty designs with infographics and other kinds of graphs or data representations, with lots of colors, to help you convey in your slides what works and...
Download the "Robotic Workshop Infographics" template for PowerPoint or Google Slides and discover the power of infographics. An infographic resource gives you the ability to showcase your content in a more visual way, which will make it easier for your audience to understand your topic. Slidesgo infographics like this set...
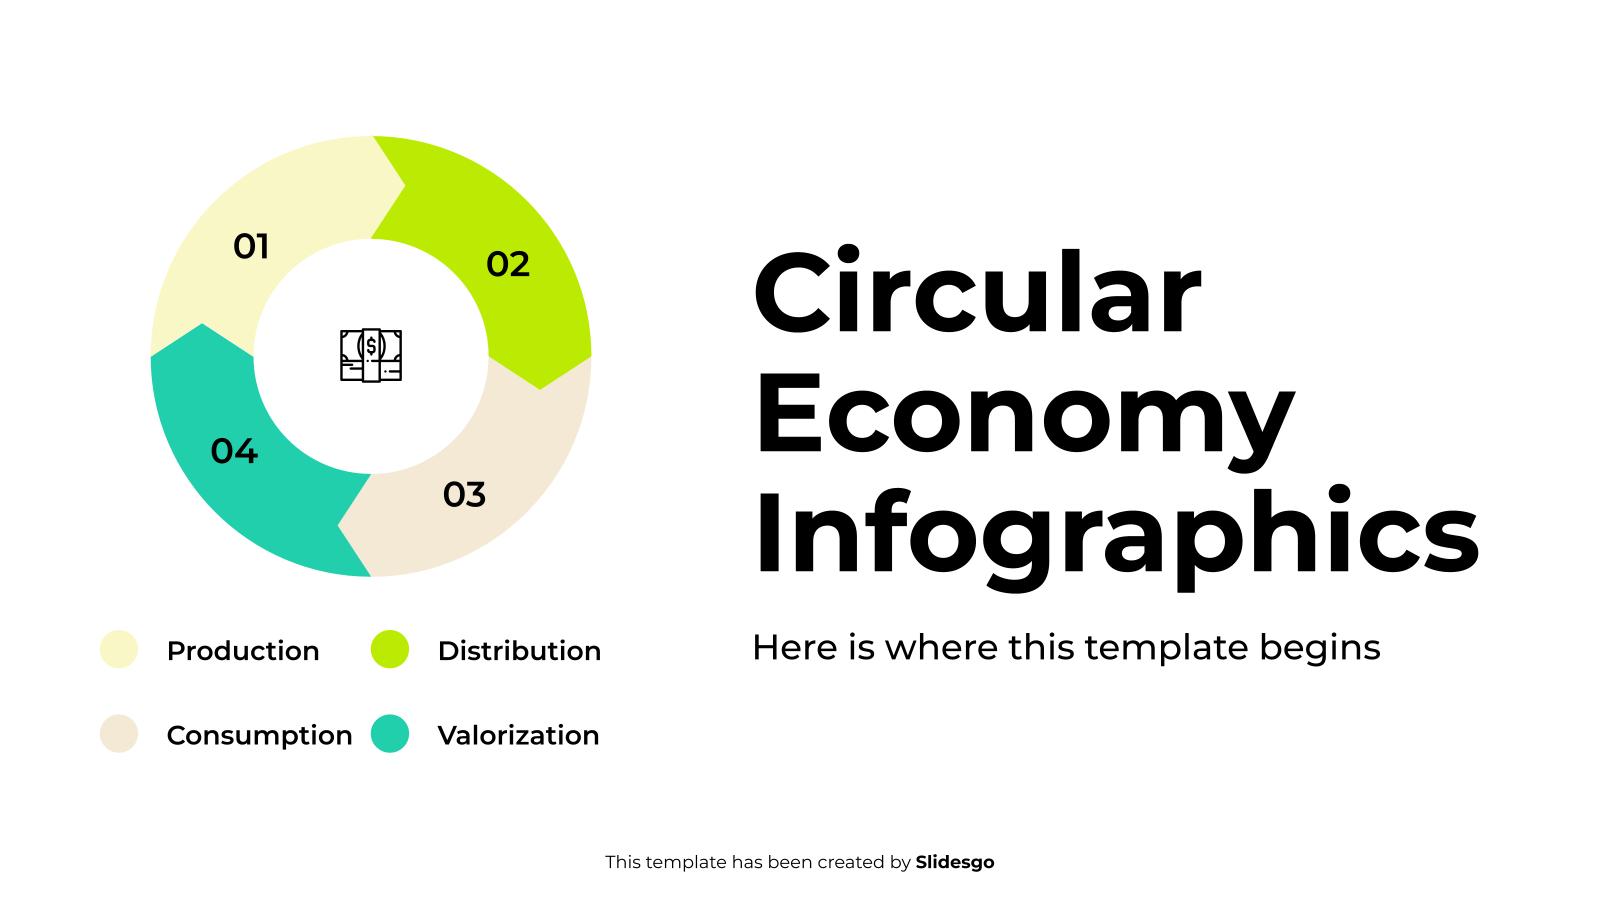
Download the Circular Economy Infographics template for PowerPoint or Google Slides to get the most out of infographics. Whether you want to organize your business budget in a table or schematically analyze your sales over the past year, this set of infographic resources will be of great help. Start using...

Download the Pricing Table Comparison Infographics template for PowerPoint or Google Slides to get the most out of infographics. Whether you want to organize your business budget in a table or schematically analyze your sales over the past year, this set of infographic resources will be of great help. Start...

Download the Business Infographics template for PowerPoint or Google Slides to get the most out of infographics. Whether you want to organize your business budget in a table or schematically analyze your sales over the past year, this set of infographic resources will be of great help. Start using infographics...

Download the Medical 4 Blocker Template Theme presentation for PowerPoint or Google Slides. Healthcare goes beyond curing patients and combating illnesses. Raising awareness about diseases, informing people about prevention methods, discussing some good practices, or even talking about a balanced diet—there are many topics related to medicine that you could...

Download the "Cycle Diagrams Theme for a Business Plan" presentation for PowerPoint or Google Slides. Conveying your business plan accurately and effectively is the cornerstone of any successful venture. This template allows you to pinpoint essential elements of your operation while your audience will appreciate the clear and concise presentation,...