Chart Infographics Presentation templates - Page 6
Charts come in many different forms: bar, pie, pyramid, cycle, you name it. Browse our infographics for Google Slides and PowerPoint and use the type that you need for your slides!

It seems that you like this template!

Register for free and start downloading now
At Slidesgo, we care that your company's finances go correctly and that you get the most economic benefit from everything you do. For this reason, we bring you some infographics on Return on Investment, also known as ROI. This financial indicator will measure the profitability of your project, action, or...

Glitter, glamor, fashion, the chance to see and be seen… you’re right, we’re talking about a movie awards ceremony! Movie award ceremonies are an exciting way for filmmakers and actors to be recognized for the hard work they have put into their projects, and the awards themselves generally recognize excellence...
For those who never remember how much they owe the bank after "borrowing $200 for a hotel" when playing Monopoly (not allowed as per the official rules, but hey), here's the solution. Infographics in the form of spreadsheets and tables. All of them related to loans and payments. Some of...

If you like abstract designs, leaves, soft colors and a Memphis style, and at the same time you wanted some help with the presentation for your thesis defense, this template might be of your taste! Like its parent template, these come with earthy tones and a combination of abstract designs...

Download the Investors Social Media Infographics template for PowerPoint or Google Slides and discover the power of infographics. An infographic resource gives you the ability to showcase your content in a more visual way, which will make it easier for your audience to understand your topic. Slidesgo infographics like this...

Download the "Cool and Slick Infographics" template for PowerPoint or Google Slides and discover the power of infographics. An infographic resource gives you the ability to showcase your content in a more visual way, which will make it easier for your audience to understand your topic. Slidesgo infographics like this...
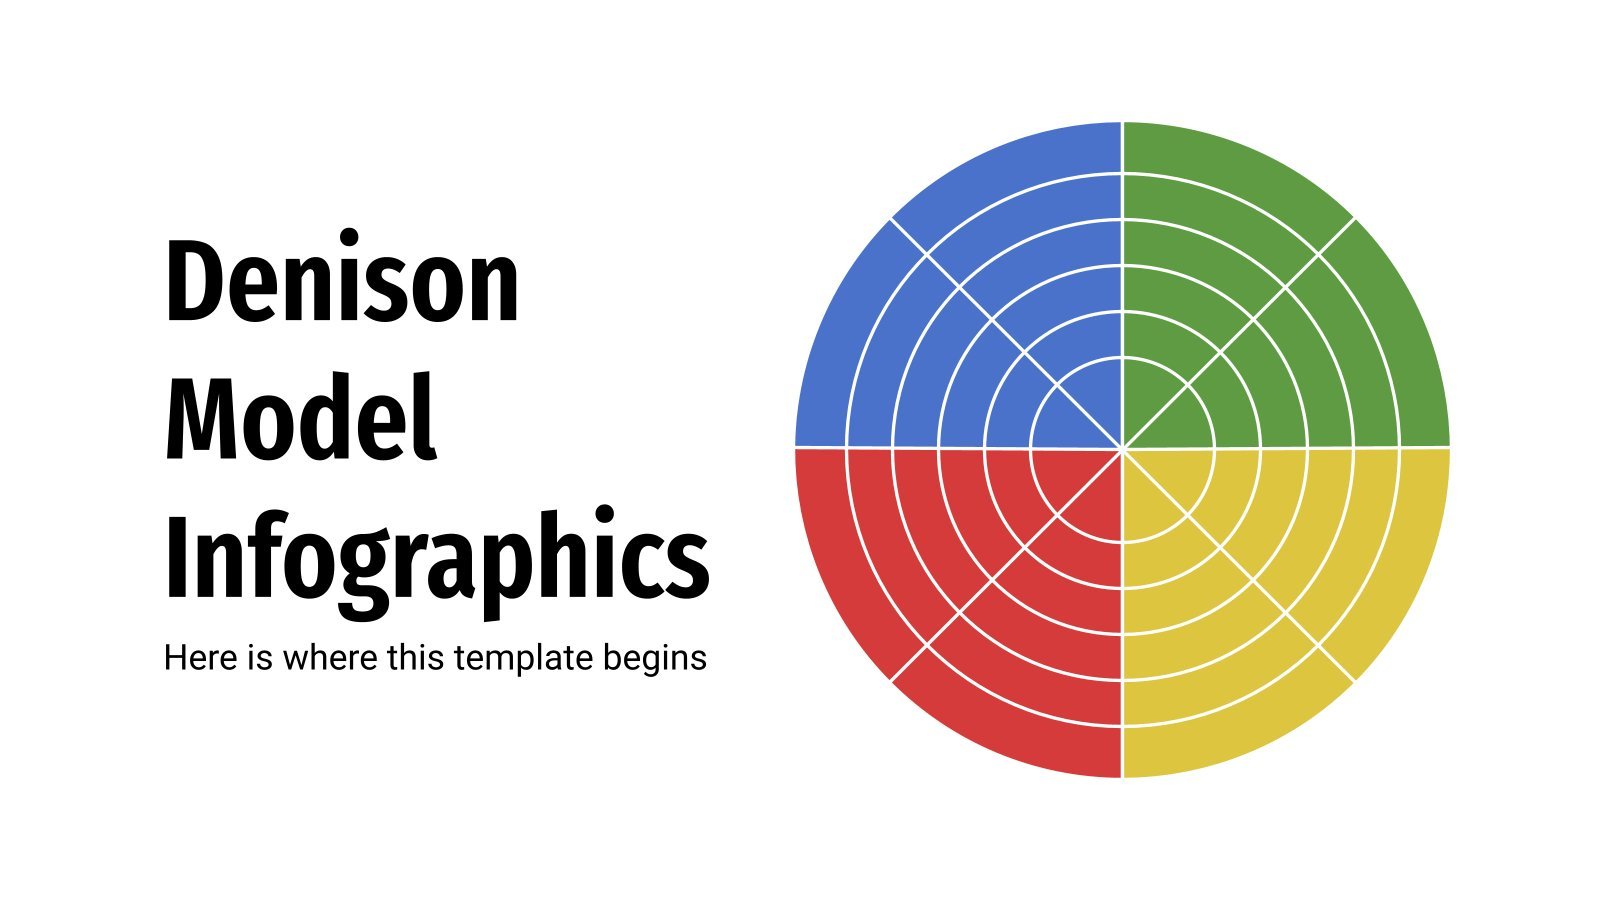
The Denison model is based on the research of Dr. Daniel Denison, who related organizational culture to certain business performance indicators. Both must be aligned to achieve business objectives. This template includes dozens of graphs and flat style infographics related to this model, which analyzes four key company factors: adaptability,...

Download the "CSR Infographics" template for PowerPoint or Google Slides and discover the power of infographics. An infographic resource gives you the ability to showcase your content in a more visual way, which will make it easier for your audience to understand your topic. Slidesgo infographics like this set here...

Will there be a day when Slidesgo releases an operating system? Like, for example, SlidesgOS? Hmmm, the name doesn't sound right, it's like we just multiplied... While we think of a better name, why don't you check out these infographics? With titles making use of those angle brackets you see...
Download the People Management Startup Business Plan Infographics template for PowerPoint or Google Slides and discover the power of infographics. An infographic resource gives you the ability to showcase your content in a more visual way, which will make it easier for your audience to understand your topic. Slidesgo infographics...

These infographic resources are designed to help consultants show clients how they can achieve success. Every consultant needs the correct information to interpret data and make informed decisions, and these infographics provide this in an easy-to-read format. What’s more, this set of infographics is the complementary tool of one of...

Math is complicated to understand for some children, especially fractions… so many numbers that mean completely different things! How is three ninths less than two fourths?? Help your students understand fractions perfectly with this set of infographics! Having visual examples of segmented pieces helps understand how fractions work, so it’s...
Download the "Coffee Infographics" template for PowerPoint or Google Slides and discover the power of infographics. An infographic resource gives you the ability to showcase your content in a more visual way, which will make it easier for your audience to understand your topic. Slidesgo infographics like this set here...

Need a little bit of extra snap for your high school immigration studies class? Check out this beautifully illustrated collection of infographics for Google Slides and PowerPoint! Specifically designed to engage and educate students on the complexities and significance of immigration, it uses fully customizable and visually compelling infographics to...

Download the "Beautiful Spring Pattern Infographics" template for PowerPoint or Google Slides and discover the power of infographics. An infographic resource gives you the ability to showcase your content in a more visual way, which will make it easier for your audience to understand your topic. Slidesgo infographics like this...

It has never been as clear as it is now: the environment needs us. Raising awareness about the importance of the environment and its preservation is a must. Let's focus today on the Amazon rainforest, a vast area that has been under deforestation for too long now. This set of...

We know that planning the strategy for the spring sales of your self-care products is not an easy task, that's why we wanted to give you a hand by creating this complete and elegant template that contains over 30 different infographics that you can customize with your figures, information and...
Pink, purple, blue and a galactic backdrop of stars and planets… what’s not to love? This collection of infographics has been designed to complement our “Realistic Galaxy Consulting Toolkit” presentation, and equips you with tons of visuals, from maps to timelines, graphs and tables to present every aspect of your...