
Business Infographics Presentation templates - Page 23
Thinking about new techniques to improve your company performance? Try our effective infographics for Google Slides and PowerPoint and present your data and results easily!


It seems that you like this template!

Register for free and start downloading now
Download the Business Calendar Infographics template for PowerPoint or Google Slides to get the most out of infographics. Whether you want to organize your business budget in a table or schematically analyze your sales over the past year, this set of infographic resources will be of great help. Start using...
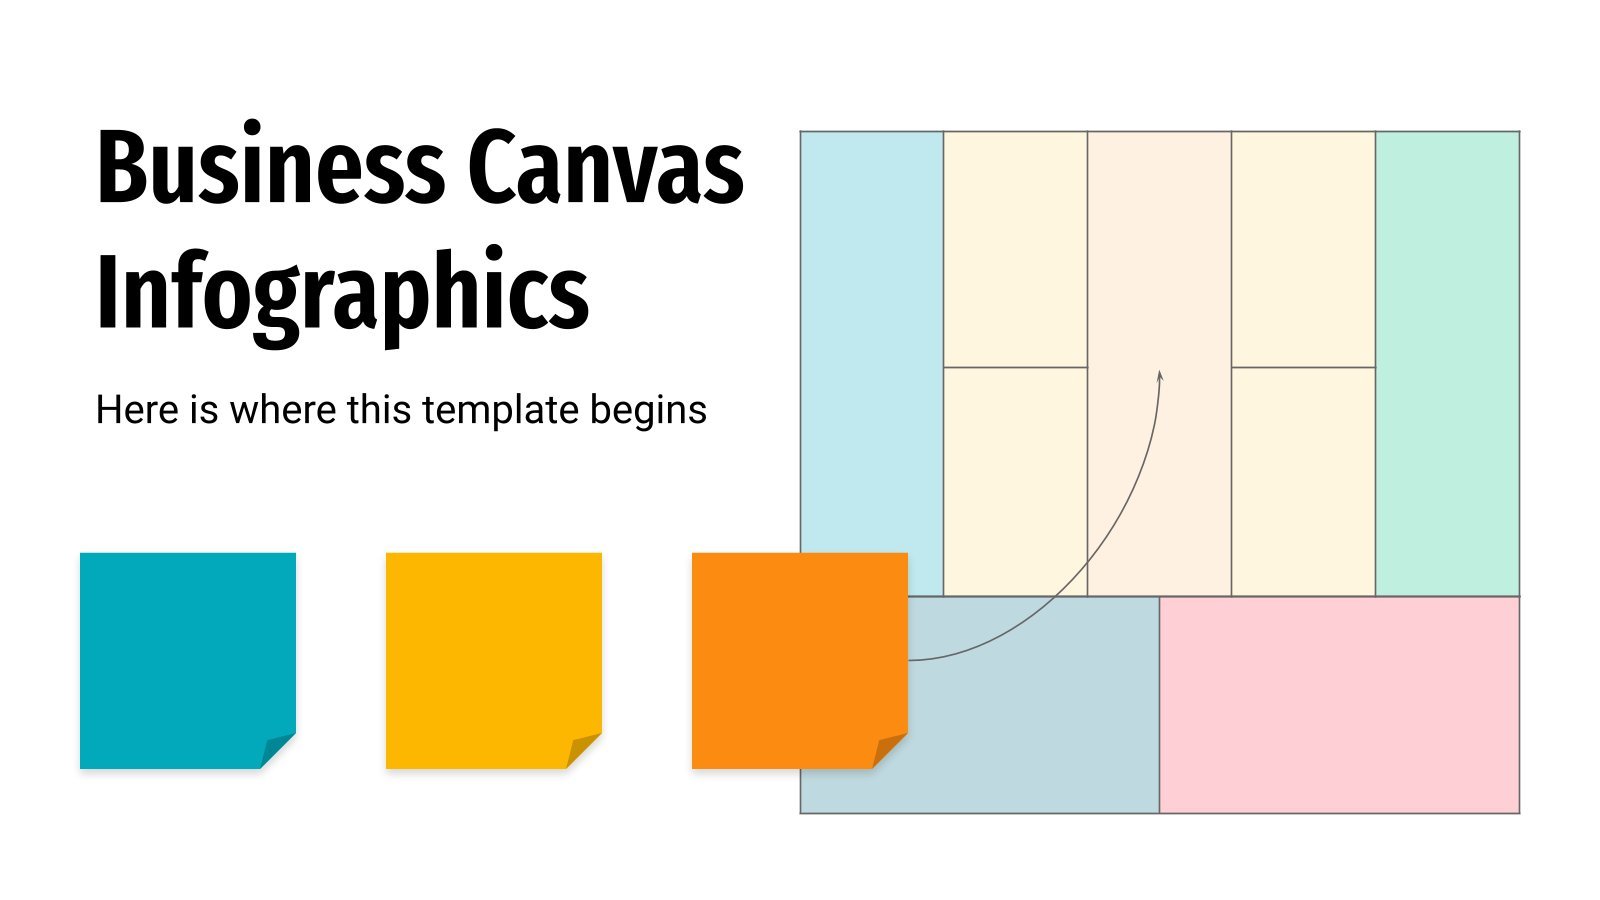
Answer questions like “What will my company do?”, “Who will we help?”, “What will it cost?” or “How will we reach our clients?” with this set of colorful infographics made so that the way to success is a clear path for you and your company. The 32 infographics show different...

Download the Minimalist Grayscale Pitch Deck Infographics template for PowerPoint or Google Slides and discover the power of infographics. An infographic resource gives you the ability to showcase your content in a more visual way, which will make it easier for your audience to understand your topic. Slidesgo infographics like...

Thinking about your next conference in the tech sector already and looking for an easy, readily-prepared way of presenting data in a visually appealing way? Look no further! These infographics come with a huge selection of editable graphs to present just about anything. Plus, you can use them with our...

There’s always a visual aid that helps you explain large amounts of information in a faster way: infographics. These graphs, maps and charts have been designed in a linear style (meaning they have no fill), and are intended for representing KPIs, or key performance indicators. If you need to give...

Download the Monthly Report Infographics template for PowerPoint or Google Slides and discover the power of infographics. An infographic resource gives you the ability to showcase your content in a more visual way, which will make it easier for your audience to understand your topic. Slidesgo infographics like this set...

What happens when a customer becomes interested in a product and wants to purchase it? He goes into a "journey", and that's what you can explain with these infographics. They contain gradients, a vivid color palette and many different designs!

Key performance indicators—one of the tools used in business to measure the success of a company. Why be so serious when you can present them visually with these doodle infographics? These pie charts, bar graphs, diagrams and tables, among other designs, give your speech a more casual tone. Try them!

In business or marketing, demographic data is essential to better understand the target audience. Use these infographics to show yours in a clear manner! Make comparisons, add percentages and organize everything in our selection of designs. Most of them have illustrations or icons that will boost your visuals!

Mekko charts, also known as mosaic plots, are visual representations of data by using stacks of tiles in different colors. Some of our designs give more leeway and are combined with other types of graphs, such as bar charts. You’ll find borderless tiles, others with stroke and even hand-drawn elements.

Perhaps you know our previous buyer persona infographics? This new set is based on the linear style, so all the designs are composed of lines of different colors. Gather the data that represents your potential customers, such as age, interests, income or motivations, and let your colleagues know by showing...

If you ever wanted to use some infographics whose elements look like hand-made and where the text is hand-written, this is the one for you. Represent your data visually and do your best during the monthly meeting. Timelines, pyramid diagrams, cycle diagrams—there's a lot to choose from. How about combining...

Download the OKR Infographics template for PowerPoint or Google Slides and discover the power of infographics. An infographic resource gives you the ability to showcase your content in a more visual way, which will make it easier for your audience to understand your topic. Slidesgo infographics like this set here...

Brainstorming is a technique in which you and your team try to come up with new ideas to solve a problem and it’s a great way of fostering creativity and teamwork. With this set of infographics, you can represent visually the ideas that your team comes up with and organize...

Download the Web Project Proposal Infographics presentation for PowerPoint or Google Slides. A well-crafted proposal can be the key factor in determining the success of your project. It's an opportunity to showcase your ideas, objectives, and plans in a clear and concise manner, and to convince others to invest their...

Download the Core Values Infographics template for PowerPoint or Google Slides and discover the power of infographics. An infographic resource gives you the ability to showcase your content in a more visual way, which will make it easier for your audience to understand your topic. Slidesgo infographics like this set...

Download the Scope of Work (SOW) Infographics template for PowerPoint or Google Slides and discover the power of infographics. An infographic resource gives you the ability to showcase your content in a more visual way, which will make it easier for your audience to understand your topic. Slidesgo infographics like...

Customize these cool infographics to introduce the different members of your team to your audience. From office workers to hospital staff, we have designed many different groups, each with its own set of text boxes. The styles are diverse and some of the illustrations come from Stories by Freepik.