Marketing Infographics Presentation templates - Page 10
Anticipate and satisfy your customers' needs creating marketing infographics with your own information! Get ready to get more and more clients showing your data and information with great diagrams!


It seems that you like this template!

Register for free and start downloading now
Pyramid diagrams are great for representing hierarchies! As you may imagine, they have a triangular shape. The most important (or main) idea will be placed at the top. This way, the widest part will represent a general idea. They can be used in different arenas: to talk about your products,...

The opinion of your customers is invaluable in order to keep improving your services, products, shops, anything! If you're going to show a report on customer satisfaction, make it more visual by using these infographics. All of them depict different emojis, representing various degrees of approval or disapproval. Most of...

Thanks to a good copywriting, the sales of your product or the visits to your website will increase significantly. However, there are many techniques for copywriting and organizing the content and how it will be published can be complicated. Don't worry, Slidesgo brings you the solution! A set of infographics...

Download the Marketing Theme with Cycle Diagrams presentation for PowerPoint or Google Slides and take your marketing projects to the next level. This template is the perfect ally for your advertising strategies, launch campaigns or report presentations. Customize your content with ease, highlight your ideas and captivate your audience with...

In a world where marketing is one of the most valued fields and one of the most used tools, you have to offer new content constantly, that's why these infographics are to be used in a thousand different ways! Among its more than 30 slides you will find the resources...
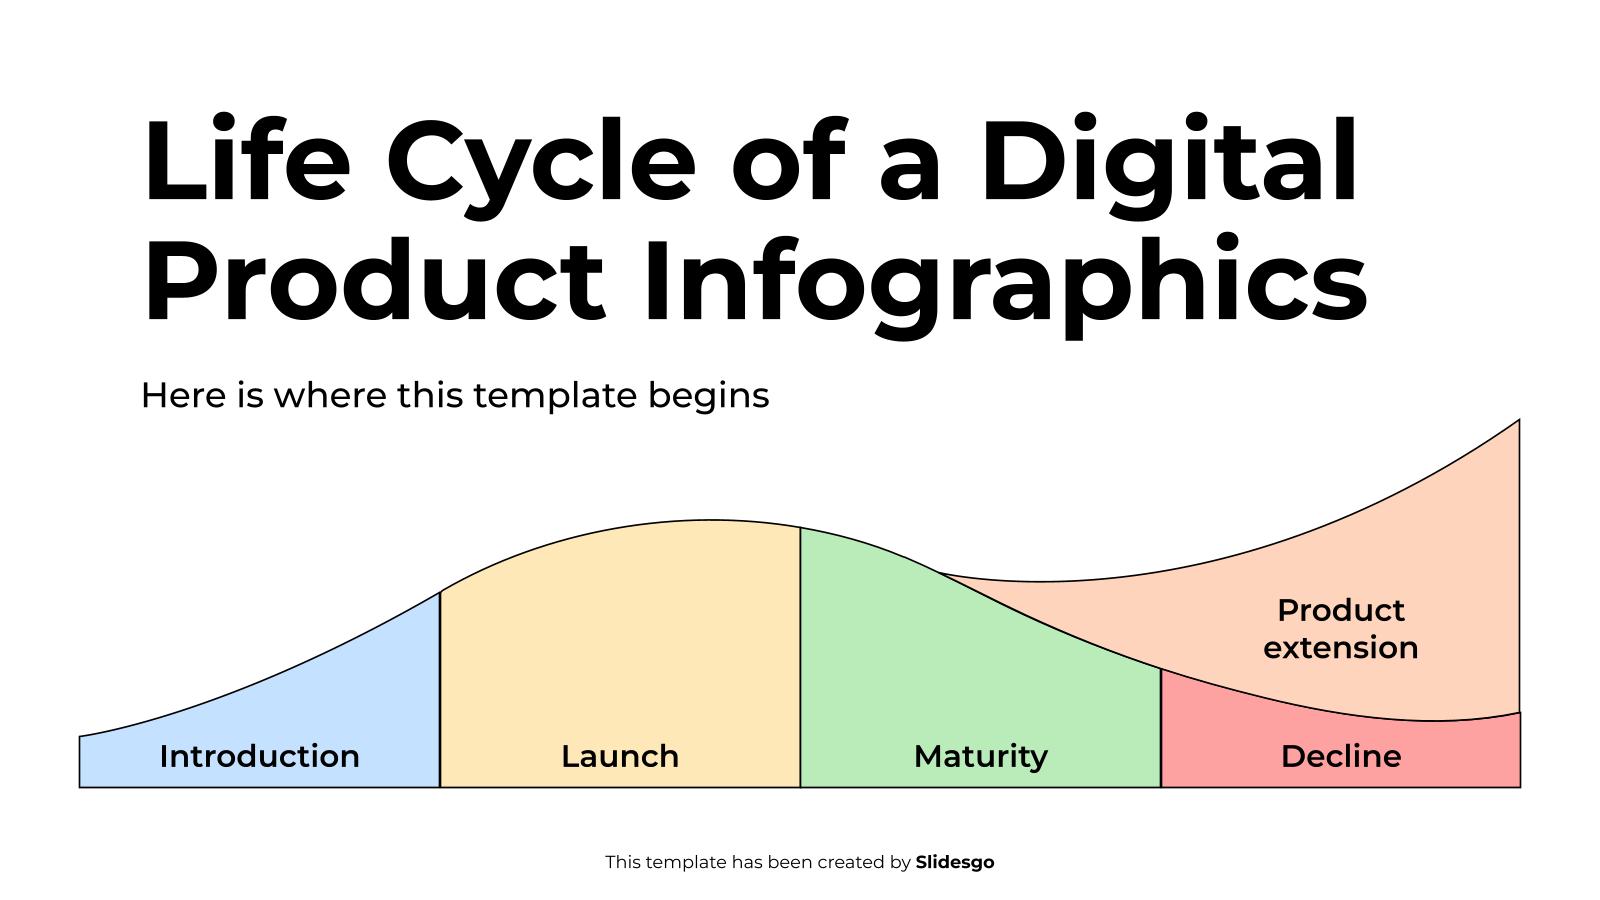
Download the Life Cycle of a Digital Product Infographics presentation for PowerPoint or Google Slides. Conveying your business plan accurately and effectively is the cornerstone of any successful venture. This template allows you to pinpoint essential elements of your operation while your audience will appreciate the clear and concise presentation,...

Day and night are so different! Some people even feel different depending on the time it is at the moment. Boost your presentations by inserting these editable infographics, which revolve around daylight and information derived from that. The designs are quite varied, with all kinds of illustrations and arrangements. There're...

Every year, the film industry produces lots of blockbusters that generate immense revenue. But that means there's a lot of marketing behind, since otherwise how can people know what movies are being premiered? Shed some light on this topic by giving an interesting speech! If you're going to use a...

These are... too many lights... I must... listen to what this marketer is trying to say! This is the set of supplementary infographics for the "Neon Palette Book Slideshow for Marketing" presentation that we released some time ago. It goes without saying: the design is super cool, as everything is...

It’s the app of the moment! Do you want to join and dance in a challenge? You must prepare first, because there’s a lot of skilled people in here. With these colorful infographics you can speak about the most viral challenges on dancing, and maybe even go viral! They are...

Sales are something almost cultural. Who hasn't waited anxiously for that moment to get a piece of clothing, an electronic device or a trip you've been looking forward to? With this infographic template you can showcase all the bargains in your business in a fun and visual way. It has...

A buyer persona is the semi-fictional representation of the ideal customer of your company or product. It is semi-fictional because the data included in the buyer persona is taken from real data of your existing customers. Thanks to the buyer persona, you can define what kind of customers you want...

A great way of understanding the business health of your company is to make a SWOT analysis. These kinds of analysis take into account the strengths, weaknesses, opportunities and risks of your situation and create a clear image of the situation. Representing these ideas with a set of infographics like...

Why are infographics so great? Here are a few reasons: 1. They show concepts in a concise way - the audience doesn’t need to read a long text or listen to a long-winded explanation. 2. They’re visually appealing - a good bunch of infographics will make any presentation look more...
Download the "Use the Recycle Bins! MK Campaign Infographics" template for PowerPoint or Google Slides to get the most out of infographics. Whether you want to organize your business budget in a table or schematically analyze your sales over the past year, this set of infographic resources will be of...
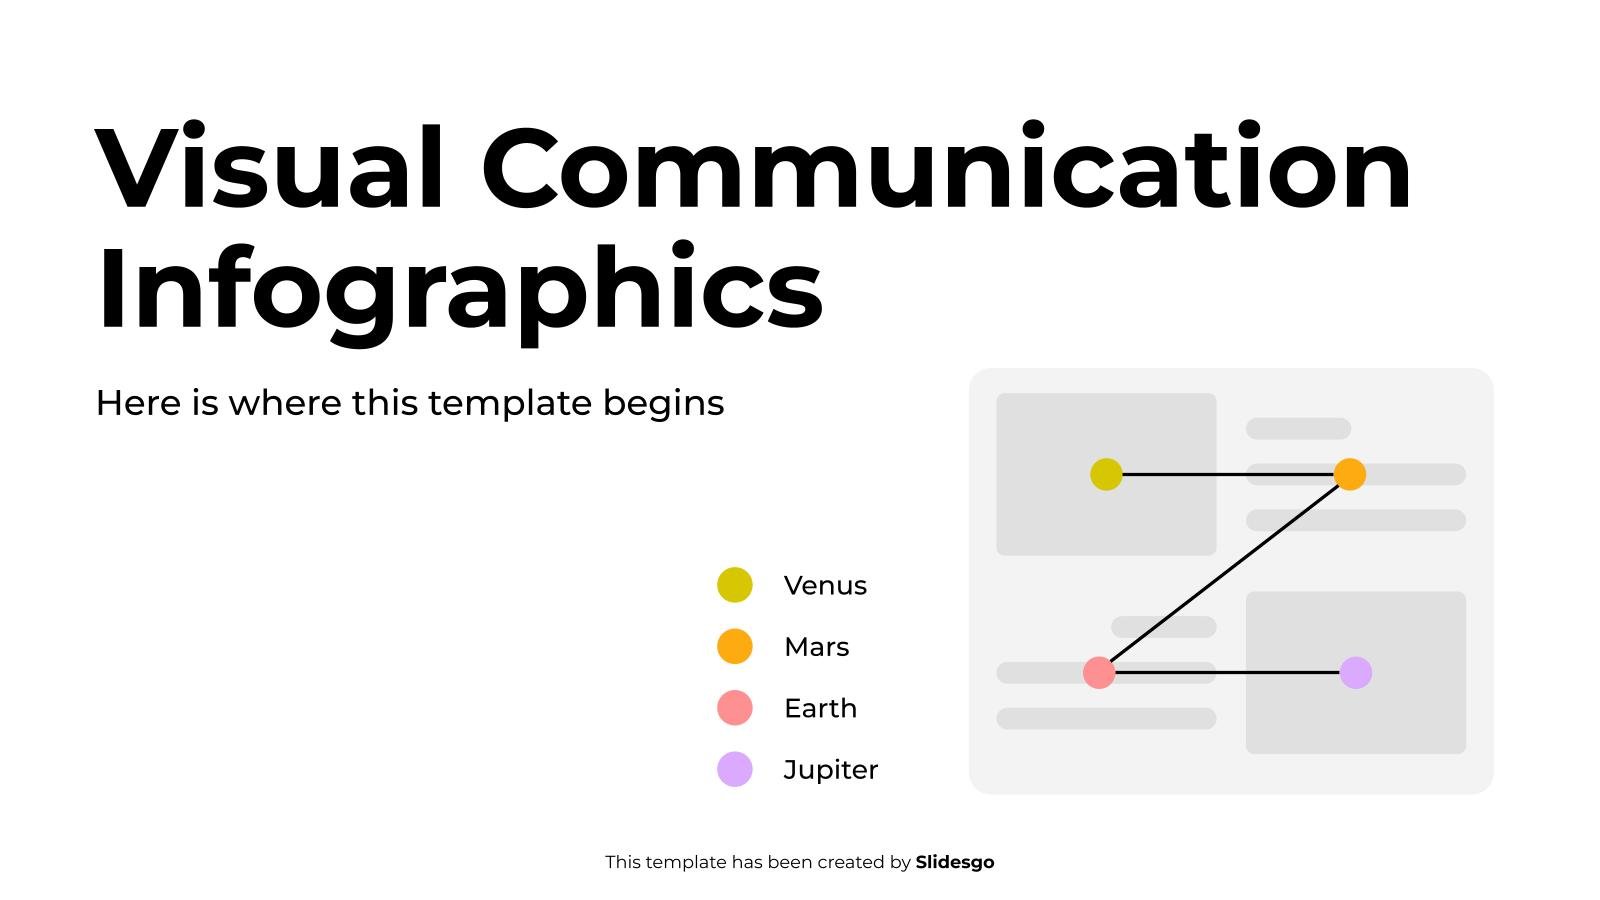
Download the Visual Communication Infographics template for PowerPoint or Google Slides to get the most out of infographics. Whether you want to organize your business budget in a table or schematically analyze your sales over the past year, this set of infographic resources will be of great help. Start using...

Have you recently conducted a survey? Perhaps has there been an election in your town? No matter what, gather the results and put them into an understandable state thanks to these infographics. Lots of percentages, graphs, bars and resources are supplied to help you be more precise with the information.

Are you familiar with persuasive advertising techniques? If you work in the marketing world, techniques such as bandwagon or snob appeals, will be concepts that are part of your vocabulary as a marketer. And to add you to organize persuasion techniques in advertising, we have designed this set of infographics...