
How to Create a Flowchart in PowerPoint

A flowchart is a graphic representation of a process in which each step appears as a symbol and these are connected with arrows. In this tutorial, you’re going to learn how to create flowcharts for your PowerPoint presentation.
Creating a Flowchart from Scratch
- Open your PowerPoint presentation and go to the slide where you want to insert the flowchart.
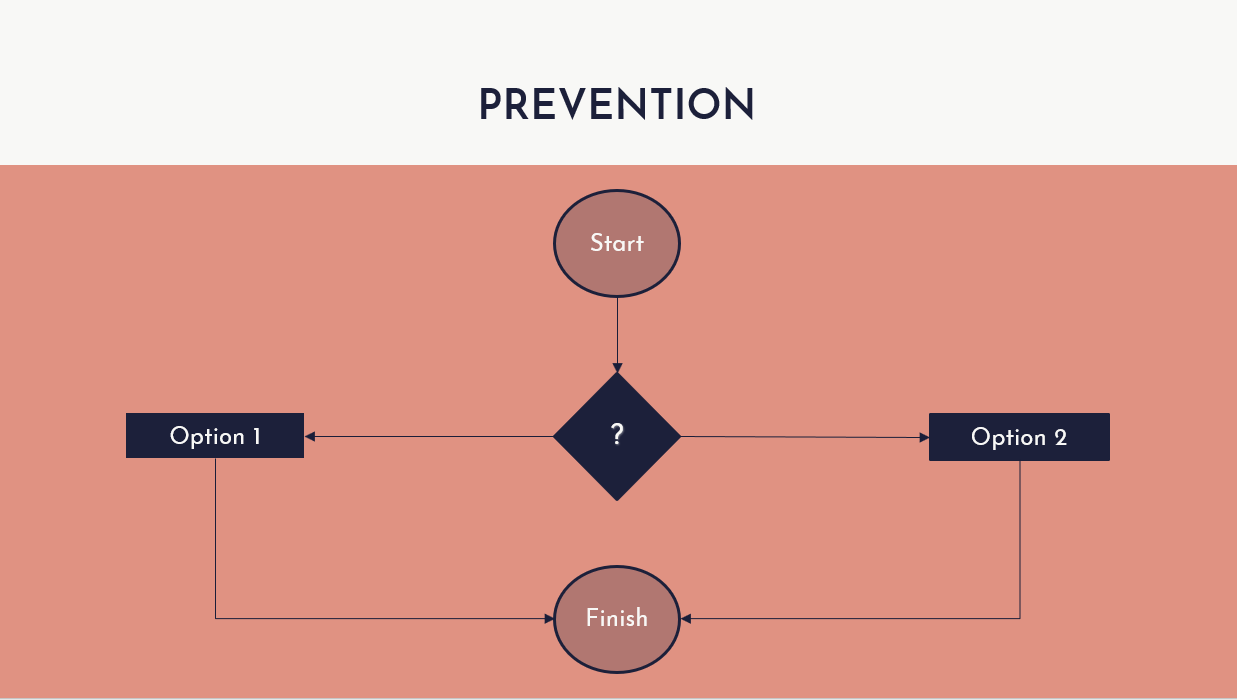
- This kind of diagram is composed of shapes. Please note that each type of shape means different things:
- A rectangle equals a process and is used for the main steps.
- A diamond equals a decision and is used in inflection points within the process.
- An oval equals a terminal point and indicates the beginning or the ending of a process.
- To insert a shape, go to the Insert tab and click Shapes.
If you want to modify the shape, select it and, on the Shape Format tab, click Edit Shape → Change Shape, or you may choose Edit Points to adjust the shape manually.
For this tutorial, we’re going to do the following:
- Create an oval shape.
- On the Shape Format tab, click Shape Fill to select the desired color for the fill.
- On the Shape Format tab, click Shape Outline to select the desired color for the border.
- Center the shape horizontally on the slide. To do so, use the guides or the Align options.
If you need more information, please refer to the “How to Arrange and Align Elements in PowerPoint” tutorial.

- To insert a text inside the shape, double-click the shape. Now you can type your text. Don’t forget to use a suitable font. If you’re using our templates, you’ll find the fonts used in the final slides.

- Insert as many shapes as you see fit. Try to align them properly using the guides and make sure the distance from the border is consistent.
- To connect two shapes, first insert an arrow. On the Insert tab, click Shapes and choose an arrow.
If you hover over a shape, you’ll see various anchor points. You can use these as connection points for the arrows. Once the arrows have been inserted, you can edit their color by choosing one of the options in the Shape Styles box.

You can also insert shapes and/or arrows by clicking on the desired one from the box in the Drawing group, on the Home tab. If you do it this way, to change the color of an arrow, select it and choose one of the options in the Shape Styles box, on the Shape Format tab.

A flowchart must have a starting and an ending point, and all the elements must be connected. Here’s an example:
Inserting a Preset Diagram
- Open your PowerPoint presentation and select the slide where you want to insert a flowchart.
- On the Insert tab, click SmartArt.
- Choose the diagram that best suits your needs. As an example, we’re going to insert the “Repeating Bending Process” diagram (on the “Process” list).

- Adjust the size of the diagram by dragging the anchor points. To keep the proportions, hold Shift while doing so.
- To change the size of an individual shape, double-click on it first.

- You can change the colors of the shapes and the lines. To do so, on the SmartArt Design tab, click Change Colors. Don’t forget to take into account the chosen palette for the presentation.

- To edit the text inside a shape, just click on it and type your own. Then, you can modify its size, color or font, among other things, by using the options found in the Font group, on the Home tab.
- You can even insert icons inside the shapes. If you’re using our templates, just copy an icon from the final slides and paste it. It’s best if you use icons that fit the topic of your presentation. To change the color of an icon, select it and, on the Shape Format tab, click Shape Fill.

If you need to add more elements to the diagram or the flowchart, just insert new shapes and/or arrows. Follow the instructions found in the “Creating a Flowchart from Scratch” section of this tutorial.
Do you find this article useful?
Related tutorials

How Smart Template Matching Saves Hours on Your Next Presentation
Content Find your perfect template, automatically How it works Templates that match your topic Get better results FAQ Skip the Search, Start Creating Find your perfect template, automatically Great presentations look intentional—where the design supports the message. But finding a template that fits usually means scrolling through dozens of options....

Creative PowerPoint Night Ideas
Want to be the star of your next PowerPoint Night? With the right ideas and a spark of creativity, you can turn any theme into a show-stopping experience that keeps everyone laughing and engaged. Whether you’re planning a friendly game night, a classroom challenge, or a team-building session, this guide is your...

Smart Guide: Best AI Prompts for Powerful Presentations
Ever stared at a blank slide, knowing your message matters but not sure how to bring it to life? You’re not alone. With the rise of AI Presentation Maker, more creators, educators, and professionals are asking: What are the best AI prompts for presentations?This guide shows you exactly how to...

How to convert PDF to PPT online for free
Ever tried making a presentation from a PDF? It’s not exactly fun—copying, pasting, reformatting… plus, it takes forever. So, why do it? Instead convert your PDF to PPT in seconds through our new tool AI PDF to PPT converter.Whether you’re pitching an idea, designing tomorrow’s lesson plan, or presenting a report, this...