
Slidesgo School: Google Slides Tutorials - Page 5
These tips and tutorials are all you need to learn how to add bullet points, music or fonts, among other things. Discover the secrets of Google Slides and edit our templates to get your message across.
Latest article
How to create a word cloud in Google Slides
2 years agoBuilding a word cloud to visualize data has a big impact on your presentation success. Here we tell you all about how to include them on Google Slides.
How to Create a Mind Map in Google Slides
A mind map is a powerful tool that allows you to create a hierarchy with your ideas and concepts. Its main aim is to help you understand and acquire information in an easier way. It resembles a diagram and it helps you learn in a visual way. Mind maps are pretty...

How to Create a Quiz for Your Online Classes Using Google Slides
Quizzes are great tools to get your audience involved, as they need to participate and give their own answers. In fact, they are particularly useful when teaching children, as their attention gets diverted quite easily. This way, they will learn in an interactive and entertaining way. Creating a quiz is not...
How to Create an Organizational Chart in Google Slides
An organizational chart depicts the different relationships in a company using graphics and helps viewers understand and visualize its structure and hierarchy. It comes in particularly useful in business plans, pitch decks, company presentations, etc. There are two ways to create an organizational chart in Google Slides. The easier way would...
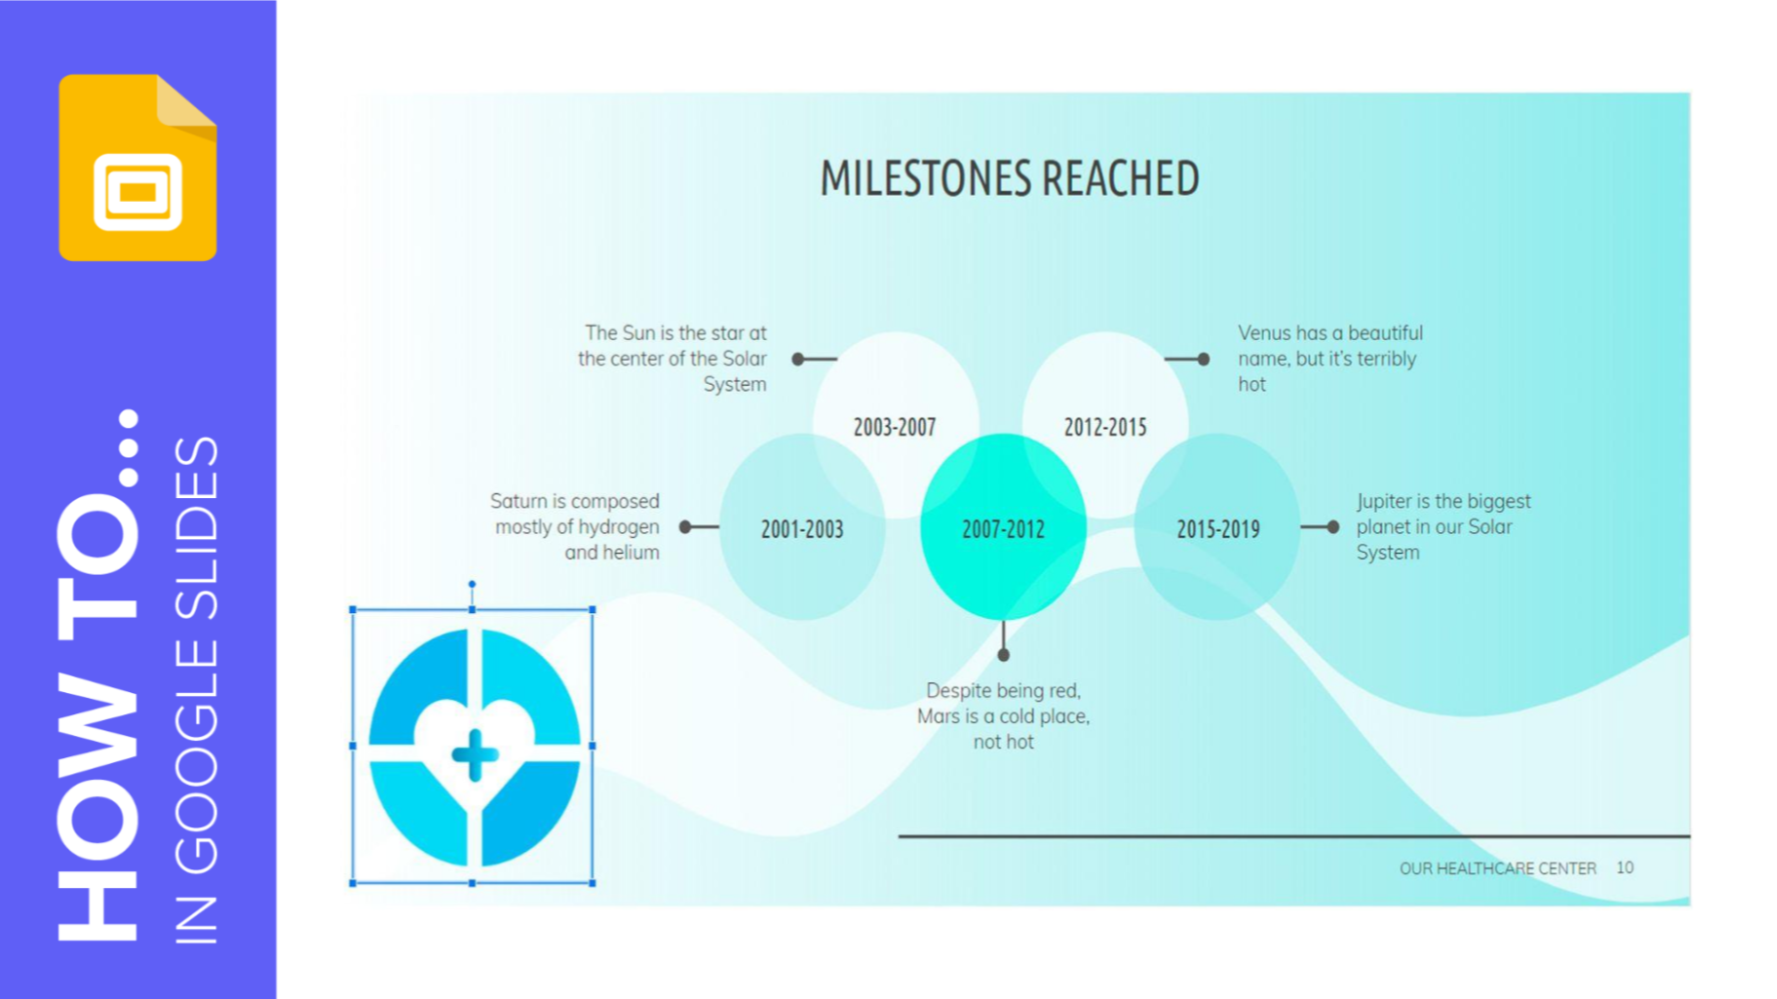
How to Create a Timeline in Google Slides
What better way to portray progress and evolution on a Google Slides presentation than with a timeline? A timeline does the job of telling a story (or history) chronologically in a direct and straightforward manner that’s also visually attractive and easy to digest. It shouldn’t contain too much text so...
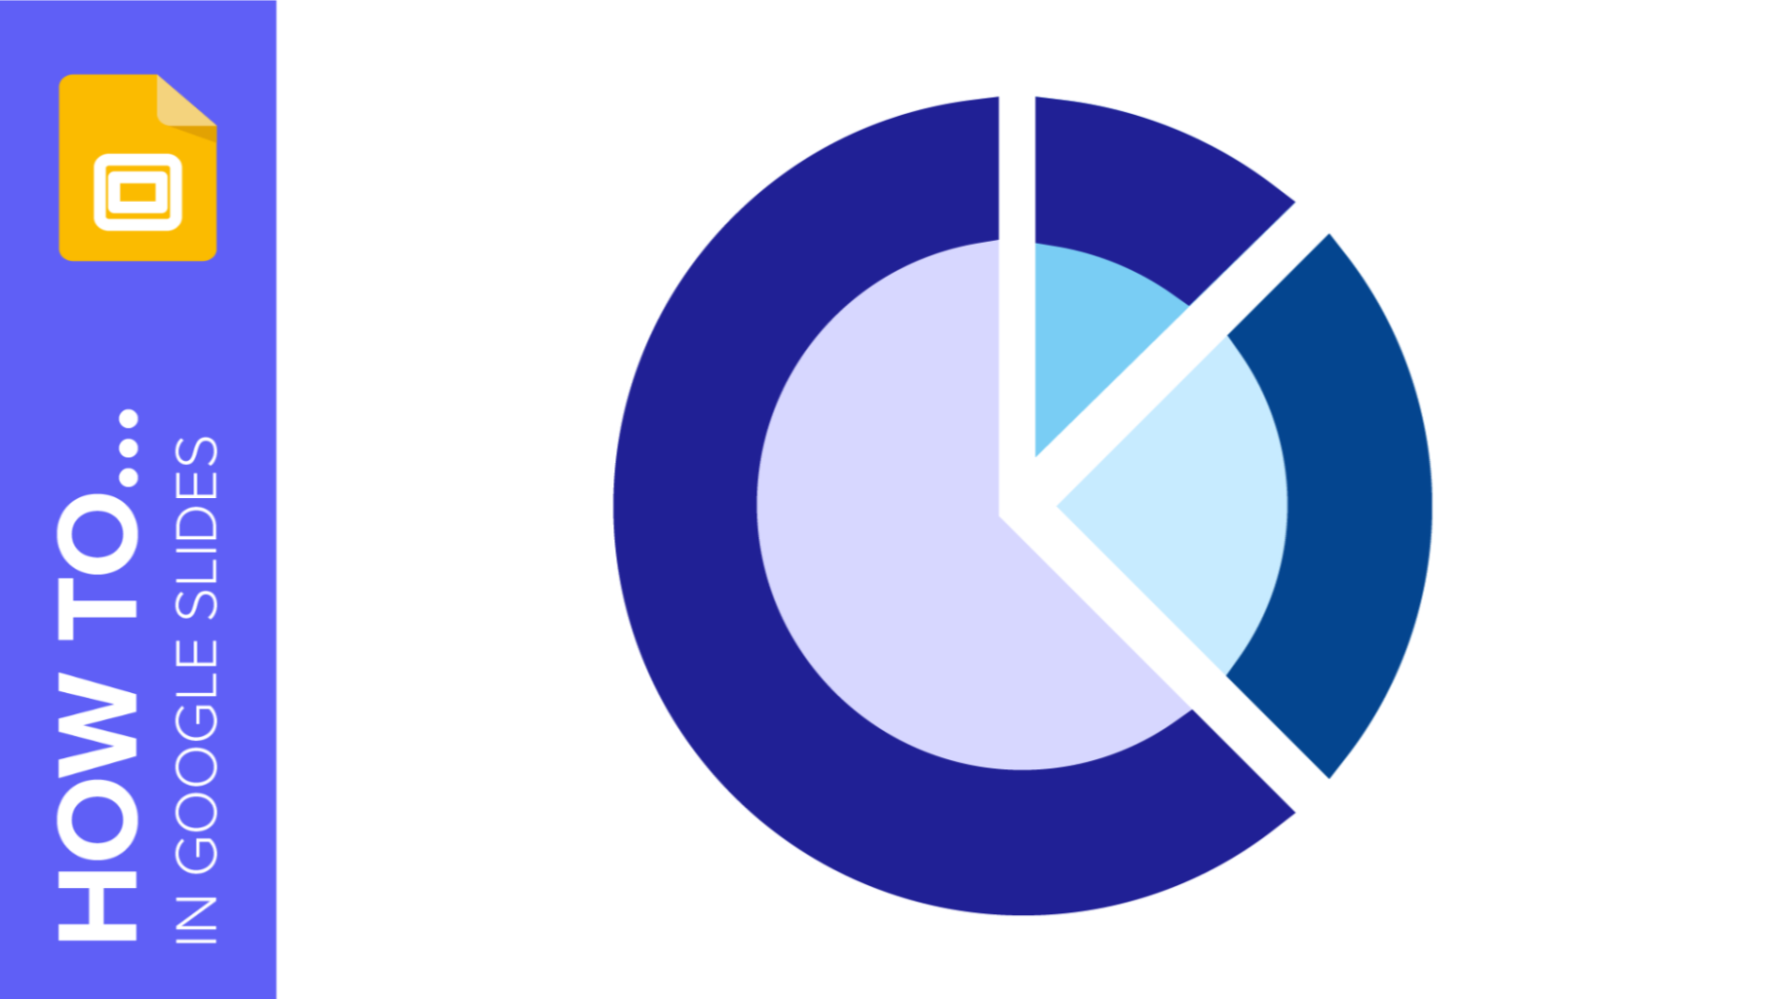
How to Make a Radial Chart in Google Slides
Presenting data on Google presentations can be done in many different ways. There are basic bar charts and pie charts. But if you want to take things a step further, radial charts are a great way to add visual effects to a presentation and simplify more complex data. This is...
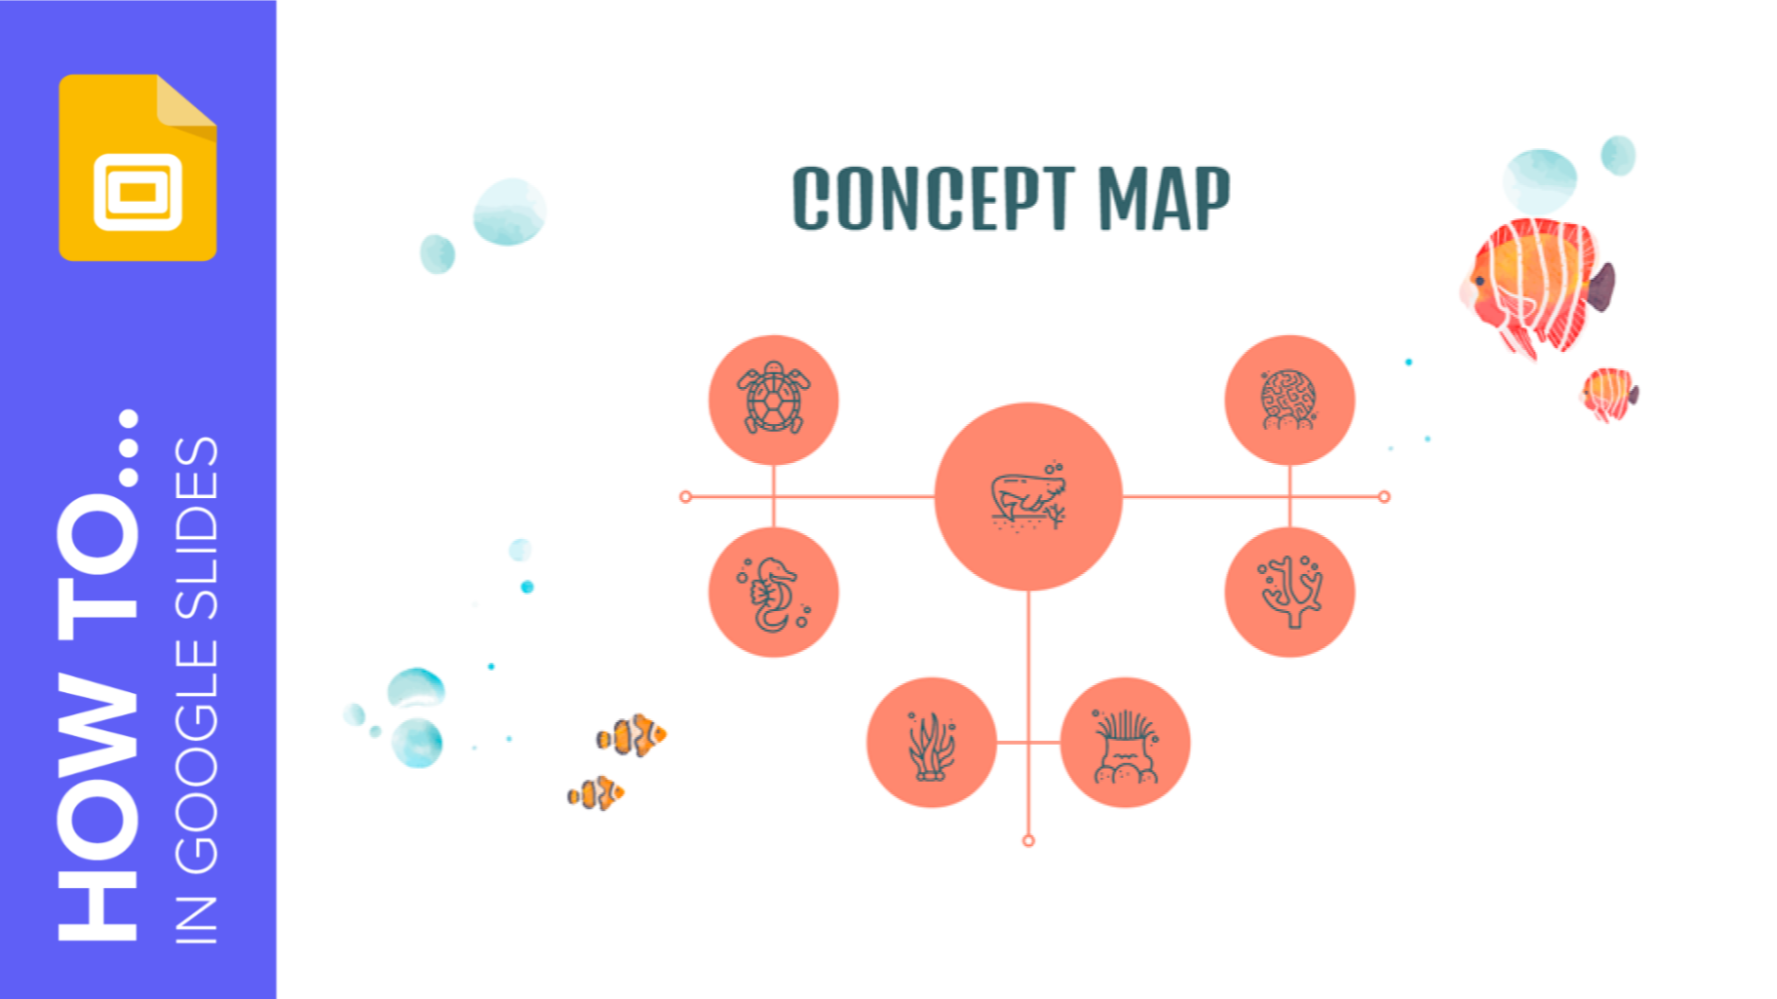
How to Make a Concept Map in Google Slides
We live in bustling times. Between work, family, social media, etc., our minds can get extremely cluttered. That can make it difficult to focus, especially when there are complex concepts to explain. This is why concept maps play a crucial role in organizing information: They make it easy to digest....
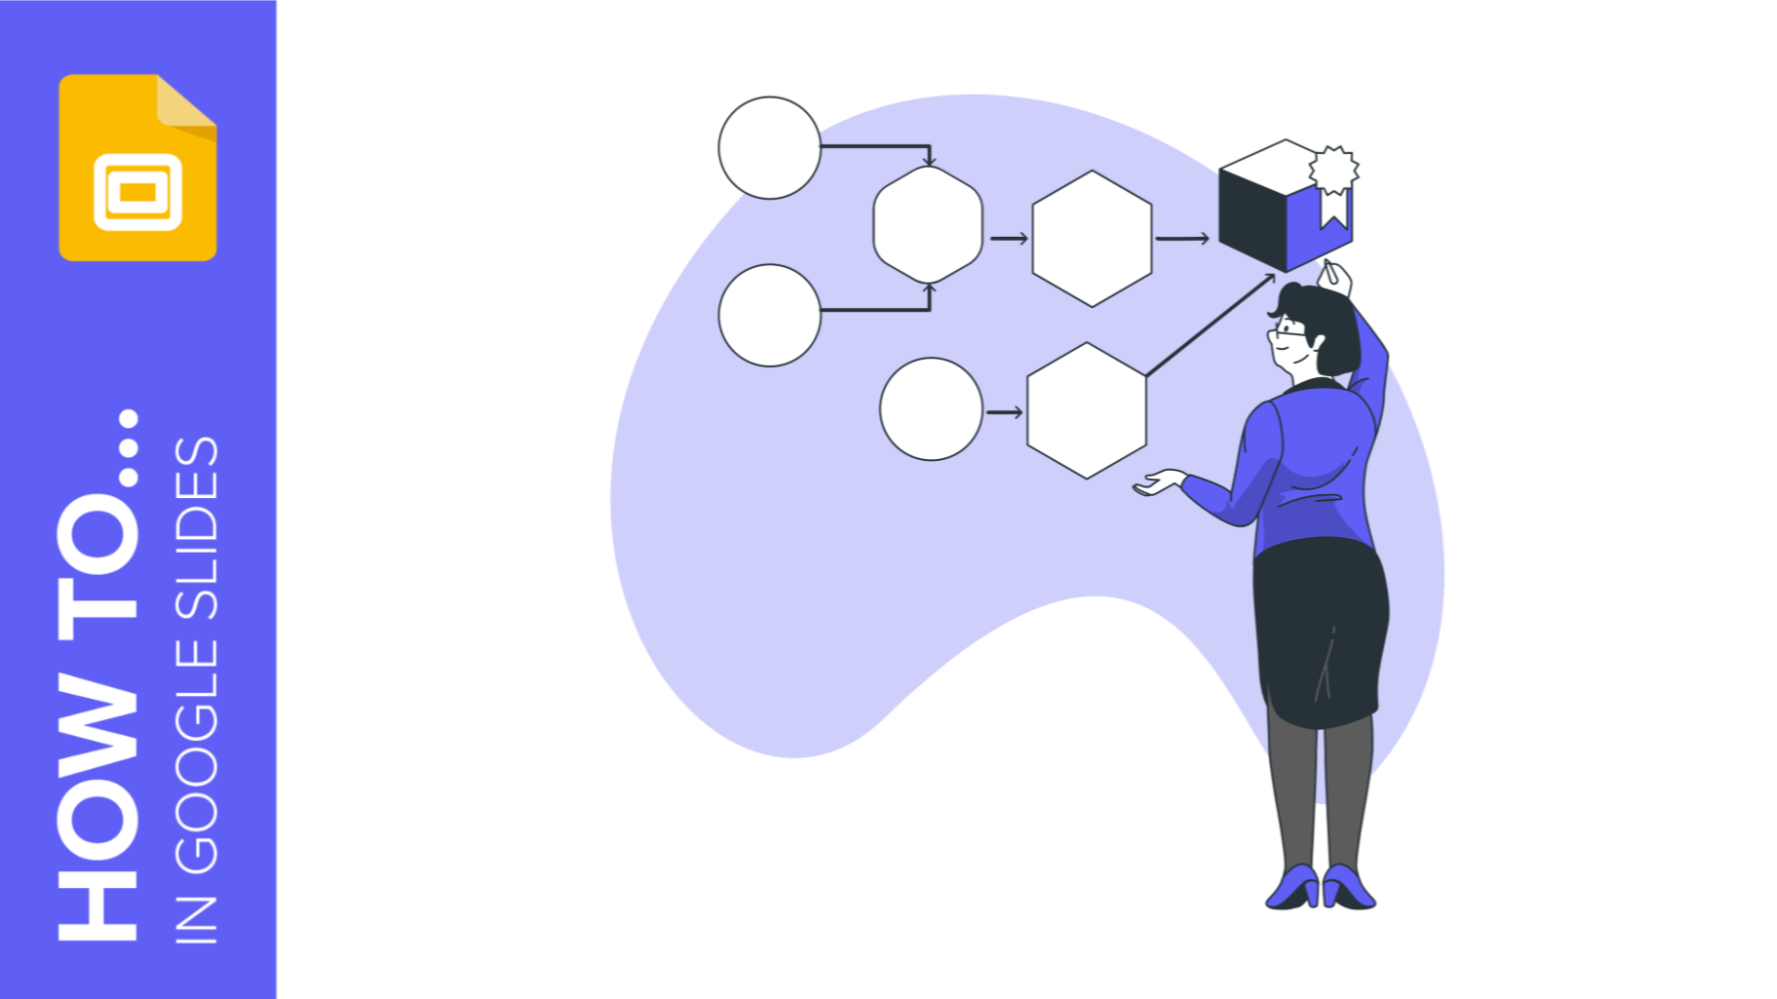
How to Create Flowcharts in Google Slides
Diagrams help you visualize all the steps of a process. In these graphic elements, each step of the process is represented with a shape, and these are connected by arrows. In this Slidesgo School tutorial, you’ll learn how to create flowcharts in Google Slides.
How to Add a Watermark in Google Slides
A watermark is a little identifying image used as a fixed element in digital creations such as photos, documents, videos or, in this case, presentations. It helps protect that creation and prevents plagiarism or uses without attribution. In this Slidesgo School tutorial, you’ll learn, step by step, how to insert...