
How to create and format maps in PowerPoint
One of the biggest challenges when making a presentation is talking about data. To make it as less tedious as possible and easy to understand, it is preferable to use visual resources instead of text. Map infographics are representations that, at a glance, help us assimilate data better and faster.
Why use map infographics?
You can use maps to add a geolocation of data to your exhibition. They are also very useful for geography and history teachers, and for international and business presentations, explaining data about different countries, expansion plans or even defining the size of your market.
Other contexts in which you can apply maps are languages; tourism, to draw a travel route; and to address territorial or international policies.
Infographic maps bring great advantages to your presentation, since they represent the information more clearly. Being a visual resource they also make the slide easier to read and more attractive, making it easier to capture the attention of your audience.
If you combine the maps with the use of icons (we will explain how to insert them later) you will make your exposition more accessible, since icons are easy to understand in any language.
Pro tip: Making your own map may not be the fastest option. At Slidesgo we have the solution! We've created a multitude of free PowerPoint map infographics that you can easily download and edit to suit your needs. They include different resources and styles that will inspire you to choose the option that best suits your presentation.
Insert a map into your presentation
Once you have selected the Slidesgo template that interests you, download it by clicking on the "PowerPoint" button and open it. And now you can start editing!
If you need to insert a map infographic into another PowerPoint file, select the map you want, copy it and paste it in the slide you want. Now you can move and adjust it. Let’s see an example:
Modify your map colors
You can adapt your map infographic to the colors you like the most, as always, we recommend that you use the theme colors to follow the style and harmony of the presentation.
Select the area of the map you want to modify, click on the Shape Fill option and select the color. Et Voilà!
Follow this same process to change the background color of the slide, selecting the slide instead of the map.
Insert and modify text on the map
Map infographics are a very attractive graphic resource, but sometimes that alone is not enough. You may need to include short texts that help your audience follow the thread of the topic.
You can easily insert them. Go to the slide where you want to add the text and click on the Insert tab on the toolbar. Click on the option Text Box. Choose in which area you are going to place it and draw the size you need with the mouse. You already have it!
Now you can write the information and format it, change the size, color, font, alignment, etc. Select the text, go to the Home tab of the toolbar and modify what you need. Let’s see how to do it:
Pro tip: You can also add internal and external links. Select the text you want to add the link to. Go to the Insert tab on the toolbar. Click on Hyperlink and paste the link.

If you prefer to add a bookmark that leads to another slide in the presentation, click on Insert - Hyperlink. Select the Bookmark option. All the slides will come out. choose which one you want the link to take you to and click OK.
Add and change icons on the map
Icons are another very useful graphic resource for saving text. You can use them to contextualize the data you include on your map slides.
At the end of Slidesgo templates you will find slides with alternative icon resources. Select the most representative for the information you need to explain. Copy it, go to the slide where you want to insert it and paste it.
Now you can move it to the area where you want to put it. You can also change the color. Select it, go to the Format section of the toolbar. Click on the Shape Fill option and choose the color you want.
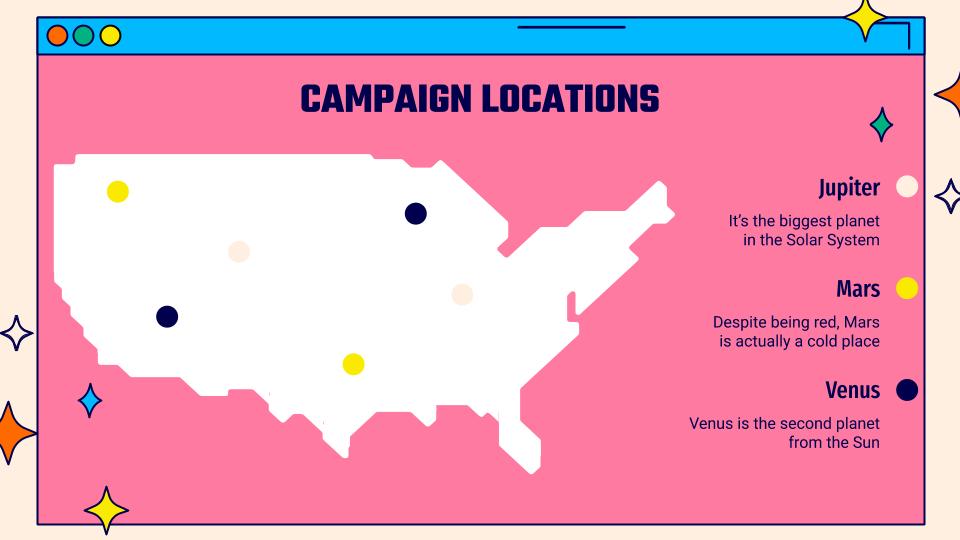
Finally, if you are going to use several icons, include a brief legend on the side of the slide to explain the meaning of each icon. Try to make it brief, so as not to distract from the rest of the elements.
Now you know how to insert and edit map infographics for PowerPoint! Put it into practice by downloading the new free PowerPoint templates from Slidesgo.
Do you find this article useful?
Related tutorials

How to present survey results in PowerPoint or Google Slides
A survey is a technique that is applied by conducting a questionnaire to a significant sample of a group of people. When we carry out the survey, we start from a hypothesis and it is this survey activity that will allow us to confirm the hypothesis or to see where...

How to Create a Venn Diagram in Google Slides
If you wish to give an awesome presentation, using diagrams is great because they make your data look nicer and help your audience understand your points.In this Slidesgo School article, we’ll teach you how to create Venn diagrams in Google Slides so you can have them in your bag of...

How to Create a Venn Diagram in PowerPoint
How many times did you have to explain your data with a PowerPoint presentation and you weren’t able to find the most visual way to do it? To help you with this matter easily and quickly, in this Slidesgo School post we will explain how to insert or create a...

How to add and edit maps in Google Slides
Map infographics are very useful for any presentation, as they allow you to transmit data quickly and easily. In this post we are going to explain how to include and edit maps in your Google Slides presentations.