
How to Add Infographics in PowerPoint

When trying to explain complicated topics or information, it’s worth using some visual aids. This way, the mind will quickly get the connections between ideas or the division of concepts. Have you ever tried using infographics?
Infographics are diagrams that will help you present or show information. It doesn’t matter if you are a teacher, a student, a marketeer or a startup owner: in Slidesgo, there are plenty of free diagrams for your projects.
Find the best PowerPoint infographics
There are plenty of different infographics. Depending on your job or area of expertise, some of them will be more useful than others. You just need to take a moment to look for the perfect one.
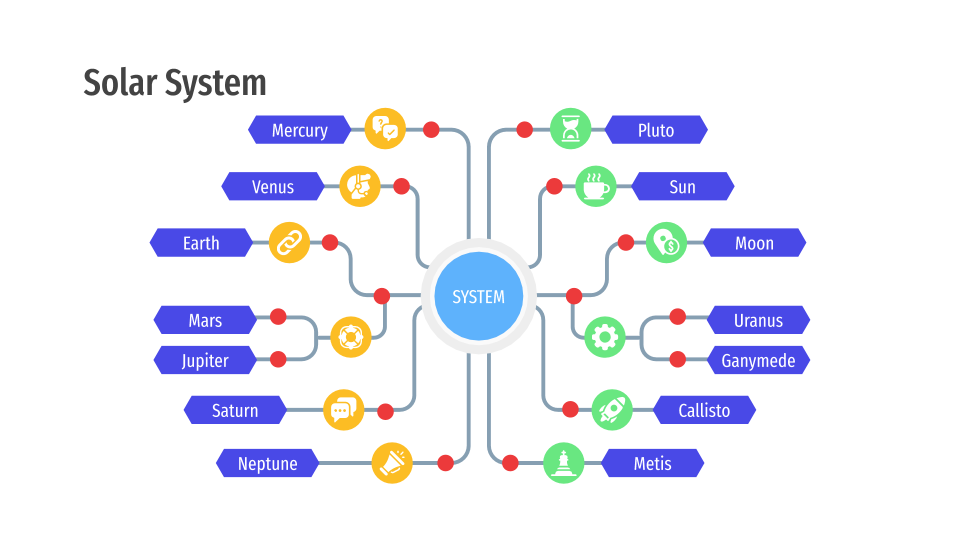
Study your needs. Let’s imagine for a moment that you are a teacher and you want to create a diagram to teach your students about the Solar System. Here, a mind map is the best option.
If what you do is more related to marketing, you can also use a mind map. See the following example, where we define the hobbies of a possible buyer persona.

→ Find creative Mind Maps here! They are pretty easy to modify, and completely free!
→ To seek the most suitable diagram for you, check our infographic themes.
How to insert infographics in a PowerPoint template
After selecting the infographic you want to use, it’s time to learn how to insert it in your presentation.
For our example, we will add an infographic to talk about a marketing strategy. Let’s proceed:
- Download and open the infographic slides and the presentation that you have chosen. For this tutorial, we decided to add a puzzle infographic.
- Now, go through the different puzzles and choose one. Click and drag to select it.
- Then, copy it by pressing Ctrl + C (or Cmd + C in Mac).
- Once you have copied it, it’s time to paste it in the slide of your presentation. To do so, you need to press Ctrl + V (or Cmd + V in Mac). Done!
Changing the colors of your diagram
As you can see, PowerPoint changes automatically the color of your infographic when you paste it. It applies the theme tones.
If you still want to change the colors of its elements, you can do it quickly!
- First, double click on the vector or element.
- In the toolbar, select Shape Fill and/or Shape Outline. Select your preferred hue, but remember to use theme hues.
Inserting texts in an infographic
Inserting icons in a diagram
As you can see, we add some icons to the infographics. They are great to connect text with ideas and to understand concepts easily. Keep reading to learn more about icons here, but you can consult our tutorial about How to Add and Modify Icons to master it!
- If you need to change some icons in order to adapt them to your own topic, we offer a lot of icons in the resources slides!
- Look for the editable icons slide.
- Select the ones you are going to use. Then click on them and press Ctrl + C or Cmd + C in Mac to copy the images. Do you want to copy more than one icon at the same time? No problem. Press Ctrl or Cmd if you are using Mac while you click on them.
- To paste them in the infographic, press Ctrl + V or Cmd + V in Mac. Click on it to move it around. As you do so or when you place it over a vector, PowerPoint will display a series of guides to help you placing it at its center and taking into consideration the rest of the icons.
- Let’s see how to modify the colors. Right click on it, then choose Group → Ungroup.
- Change the Shape Fill and Shape outline. Apply the tones of the theme.
Right click → Group → Regroup. If you find it difficult to ungroup and regroup elements, you can have a look at our tutorial.
→ If you liked the presentation that we have used for this tutorial, download this Simple Business Plan template now!
Great! Infographics are quite helpful and handy for you and for your audience. They’ll understand everything you want to say! In fact, this sort of diagram can improve your presentation in several ways. Discover how they do so reading our post!
Do you find this article useful?
Related tutorials

How to present survey results in PowerPoint or Google Slides
A survey is a technique that is applied by conducting a questionnaire to a significant sample of a group of people. When we carry out the survey, we start from a hypothesis and it is this survey activity that will allow us to confirm the hypothesis or to see where the problem and solution of what we are investigating lies.We know: fieldwork is hard work. Many hours collecting data, analyzing and organizing it until we have our survey results.Well, we don't want to discourage you (at Slidesgo we stand for positivism) but this is only 50% of the survey work....

How to Create a Venn Diagram in Google Slides
If you wish to give an awesome presentation, using diagrams is great because they make your data look nicer and help your audience understand your points.In this Slidesgo School article, we’ll teach you how to create Venn diagrams in Google Slides so you can have them in your bag of resources!

How to Create a Venn Diagram in PowerPoint
How many times did you have to explain your data with a PowerPoint presentation and you weren’t able to find the most visual way to do it? To help you with this matter easily and quickly, in this Slidesgo School post we will explain how to insert or create a Venn diagram in PowerPoint, as well as its history and components.

How to add and edit maps in Google Slides
Map infographics are very useful for any presentation, as they allow you to transmit data quickly and easily. In this post we are going to explain how to include and edit maps in your Google Slides presentations.