How to Make a Mind Map in PowerPoint

Mind mapping is a great idea to learn a series of concepts, ideas or information in a very visual way. Those mind maps are similar to hierarchical diagrams that have a series of branches. They need to be balanced, share the same ranking and must originate in the center. To divide the information into areas or fields, use different colors. It will help you visualize and learn ideas.
Mind maps are pretty useful in different contexts, as they help you synthesize, recall or analyze information. They can be key if you are developing a project or if you are a teacher, as you can use them with children. They are great for reviewing concepts!
Be a better thinker: in this post, we are going to teach you how to design a mind map in a PowerPoint template.
Planification
If you intend to create a mind map, it is because you want to transform a complex or monotonous piece of information into short, brain-friendly concepts. In our tutorial, we are going to create a mind map about astronomy, in which we are going to add some features about four planets.
It’s important to decide how many levels you want to include. Also remember to synthesise your ideas by means of keywords. For the sake of simplicity, our mind map will consist of a central idea and another level.
Central idea
Do you have a topic? Great. We have chosen features of planets, so this will be upper level in the hierarchy. All the other branches will relate to it.
- Open your PPT presentation and add a new slide. Here you’ll create the mind map. Click on New slide and choose a design.
- In the toolbar, click on Insert. In the Text section, click on Text Box.
- Click and drag to add the box. You want to establish a clear hierarchy, so make sure that you place it at the top of the slides.
- Write the concept and edit the format of your text using the Font tools. If you are still unsure of how to add text boxes or how to format texts, read our Slidesgo School tutorials.
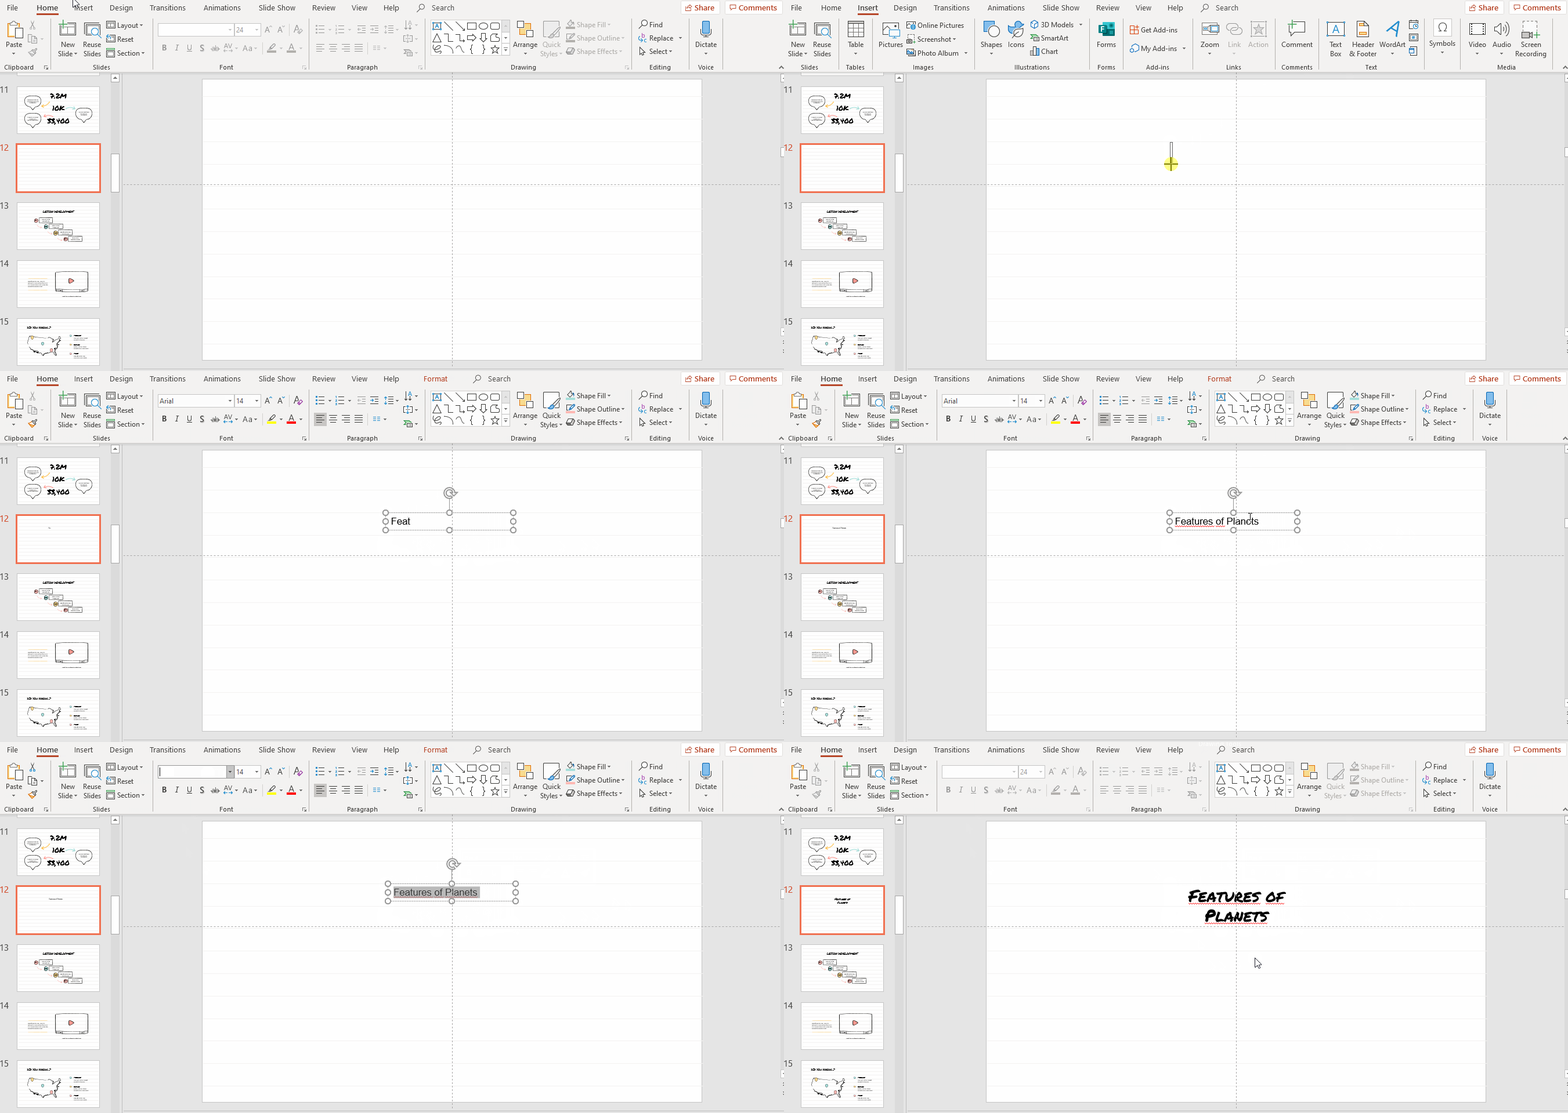
Pro tip: to show adjustable drawing lines in your slide, click on View in the toolbar. Then, in Show features, mark Guides.
Branches
Now we need to ramify your idea. For our tutorial, we will create four different branches corresponding with 4 different planets, to wit: Mercury, Saturn, Mars and Venus.
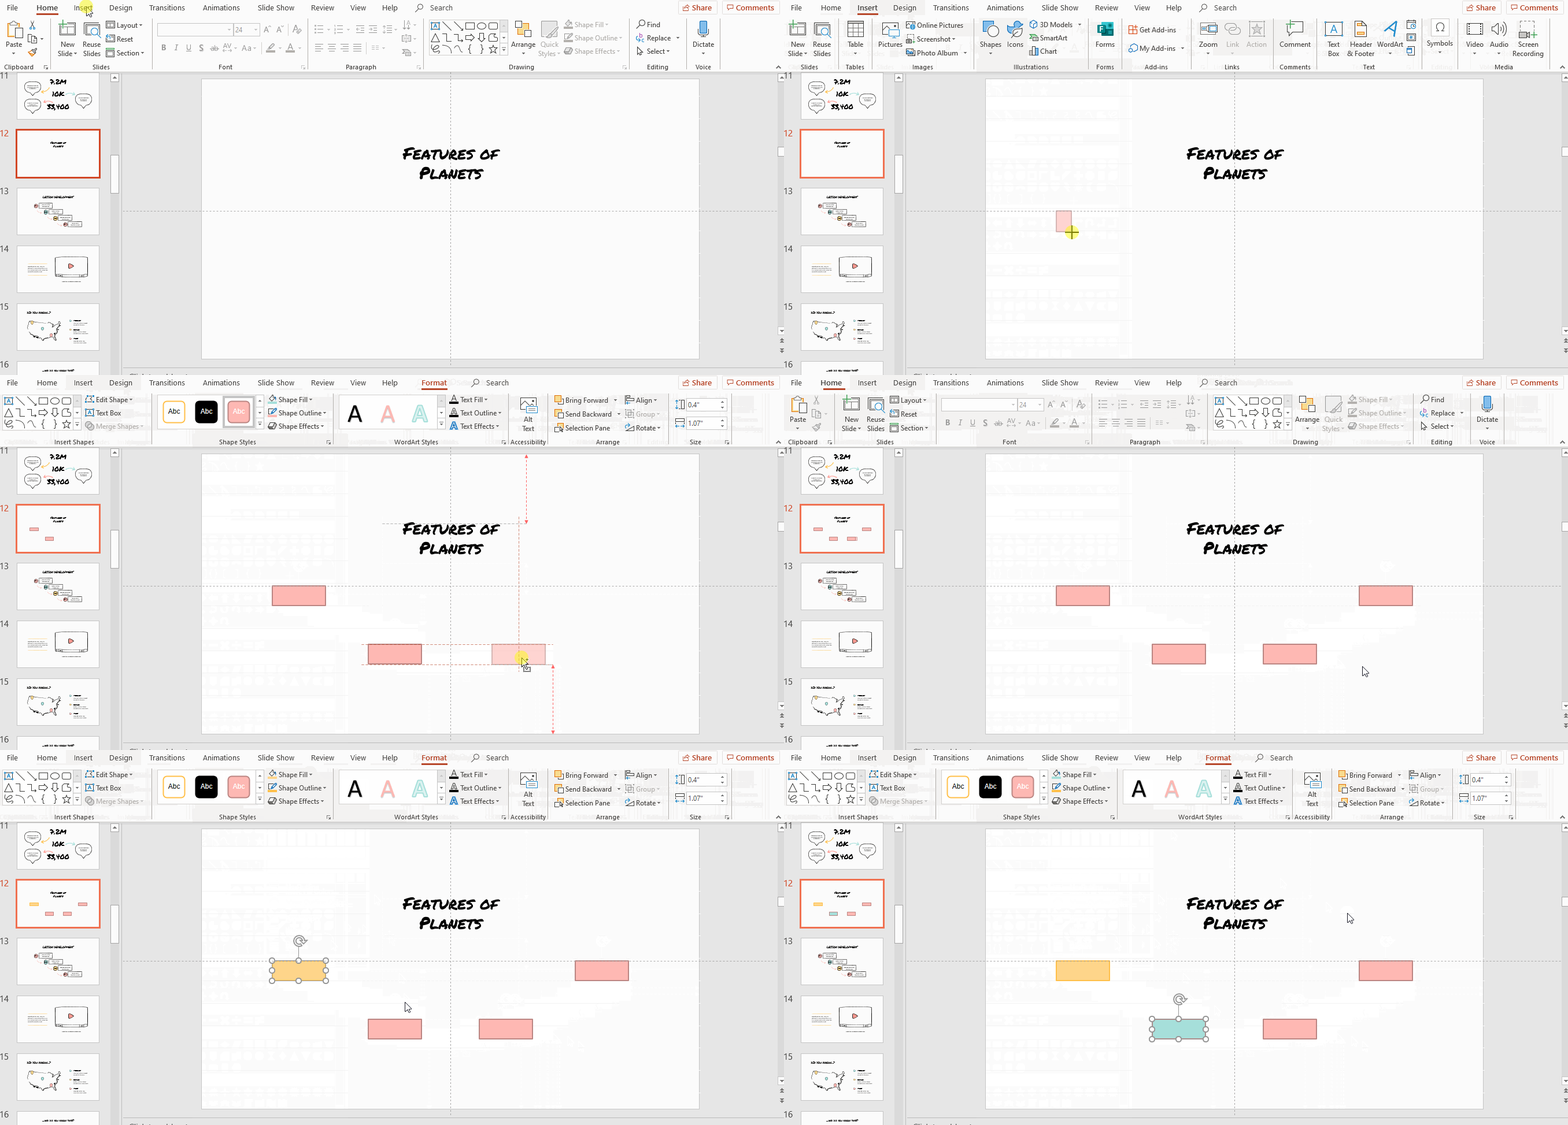
- Decide the number of branches and their structure. Here, our branches consist of a square where we add the name of the planet plus a subtitle that explains their features
- PowerPoint allows you to create shapes. Simply click on Insert → Shapes → Rectangles.
- Click and drag to create the rectangle. If you want to style it, use Shape Fill, Shape Outline and Shape Effects in the toolbar.
- There needs to be a rectangle per branch. In order to duplicate the shape, click on it while pressing Ctrl (or ⌘ if you are using Mac) and place it.
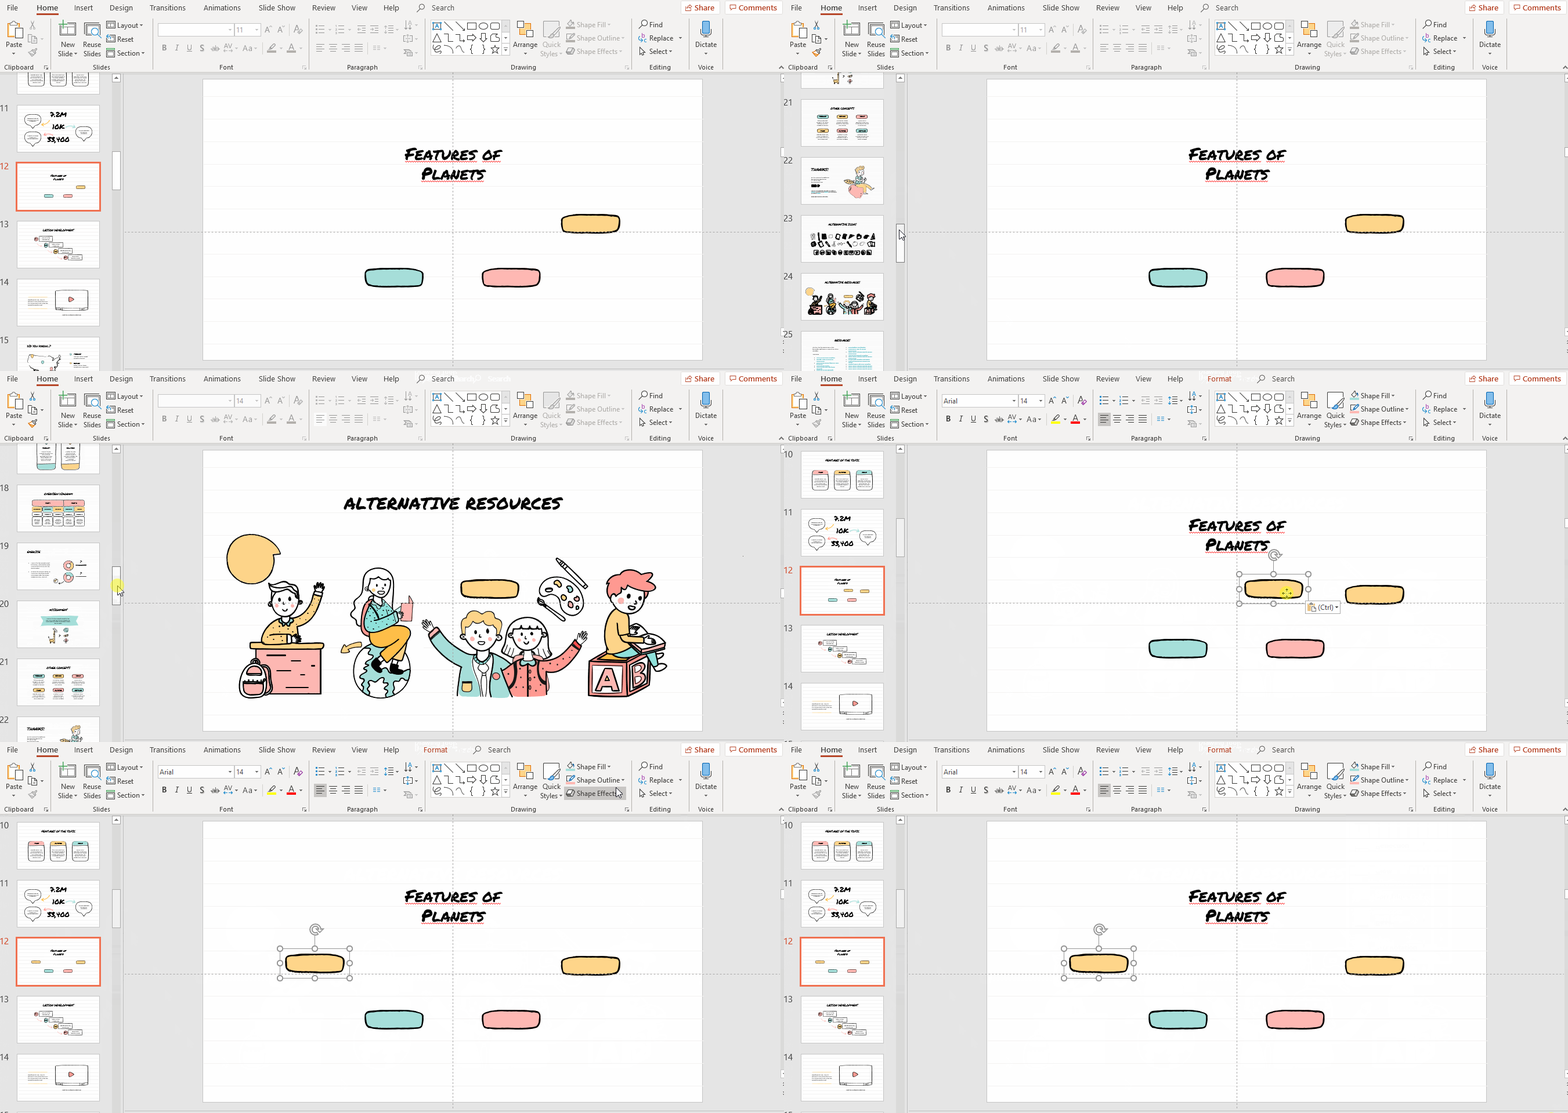
- You may want to explore other ways of creating nodes. All our templates include alternative icons and resources that you can use. They appear in the last slides, called alternative resources and icons.
- Go to any of those alternative resources slides and look for different shapes. Select the one you like pressing Ctrl+C to or ⌘+C in Mac copy it.
- Go to the mind map slide and copy the shape pressing Ctrl+V or ⌘+V in Mac. Move the shape clicking on it and dragging.
- To duplicate the rectangle, click on it while pressing Ctrl or ⌘ in Mac.
- If you want to change its style, click on Shape Fill, Shape Outline and Shape Effects in the toolbar. Remember to use the colors of the template!
Pro tip: if you use different colors related to the concepts, it will be easier for you and for other people to establish a clear distinction between ideas and to retain information. For example: Mars can be depicted using red, the Earth using blue and so on.
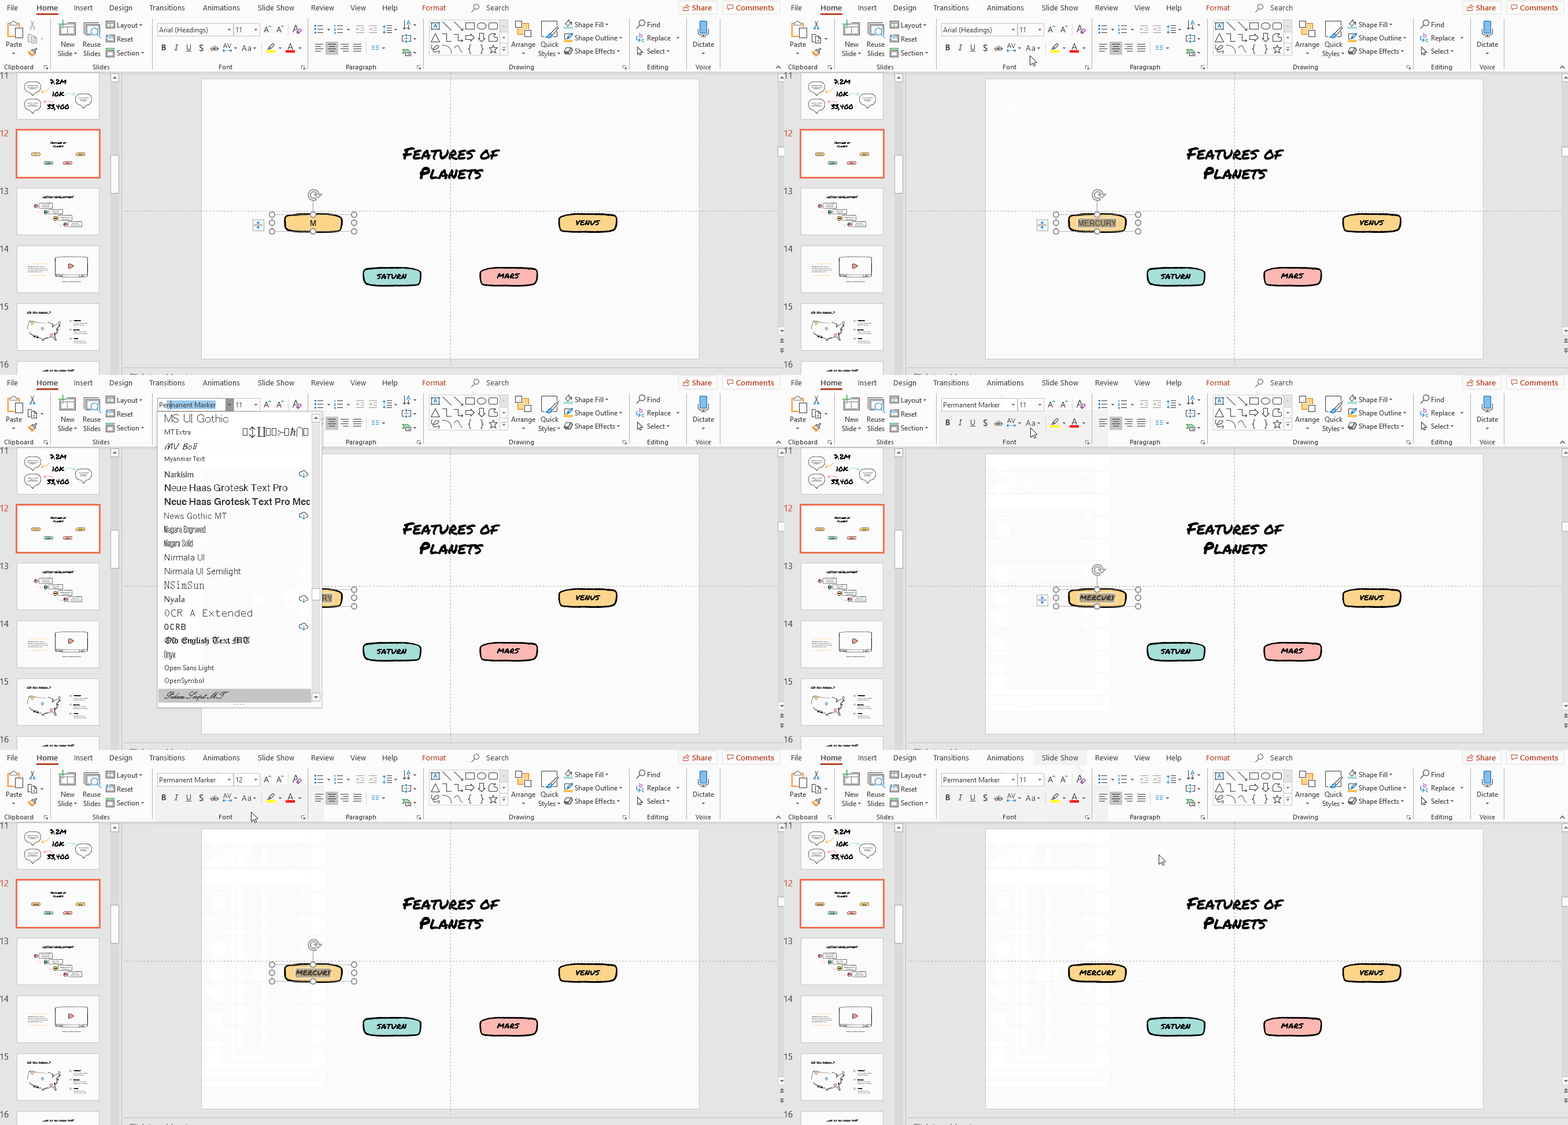
- You have successfully added the rectangles, congratulations! Let’s add some keywords to them. Click on the shape twice and begin writing. Easy!
- In the toolbar you’ll find font tools to edit your text: Font, Size and other effects such as Bold or Italics. You can also align the text.
- You’ll need to add some extra pieces of information. For our mind map, we’ll add a feature per planet.
- To do so, add a text box under each rectangle. Remember to consult the tutorial about text boxes above and to edit the font accordingly.
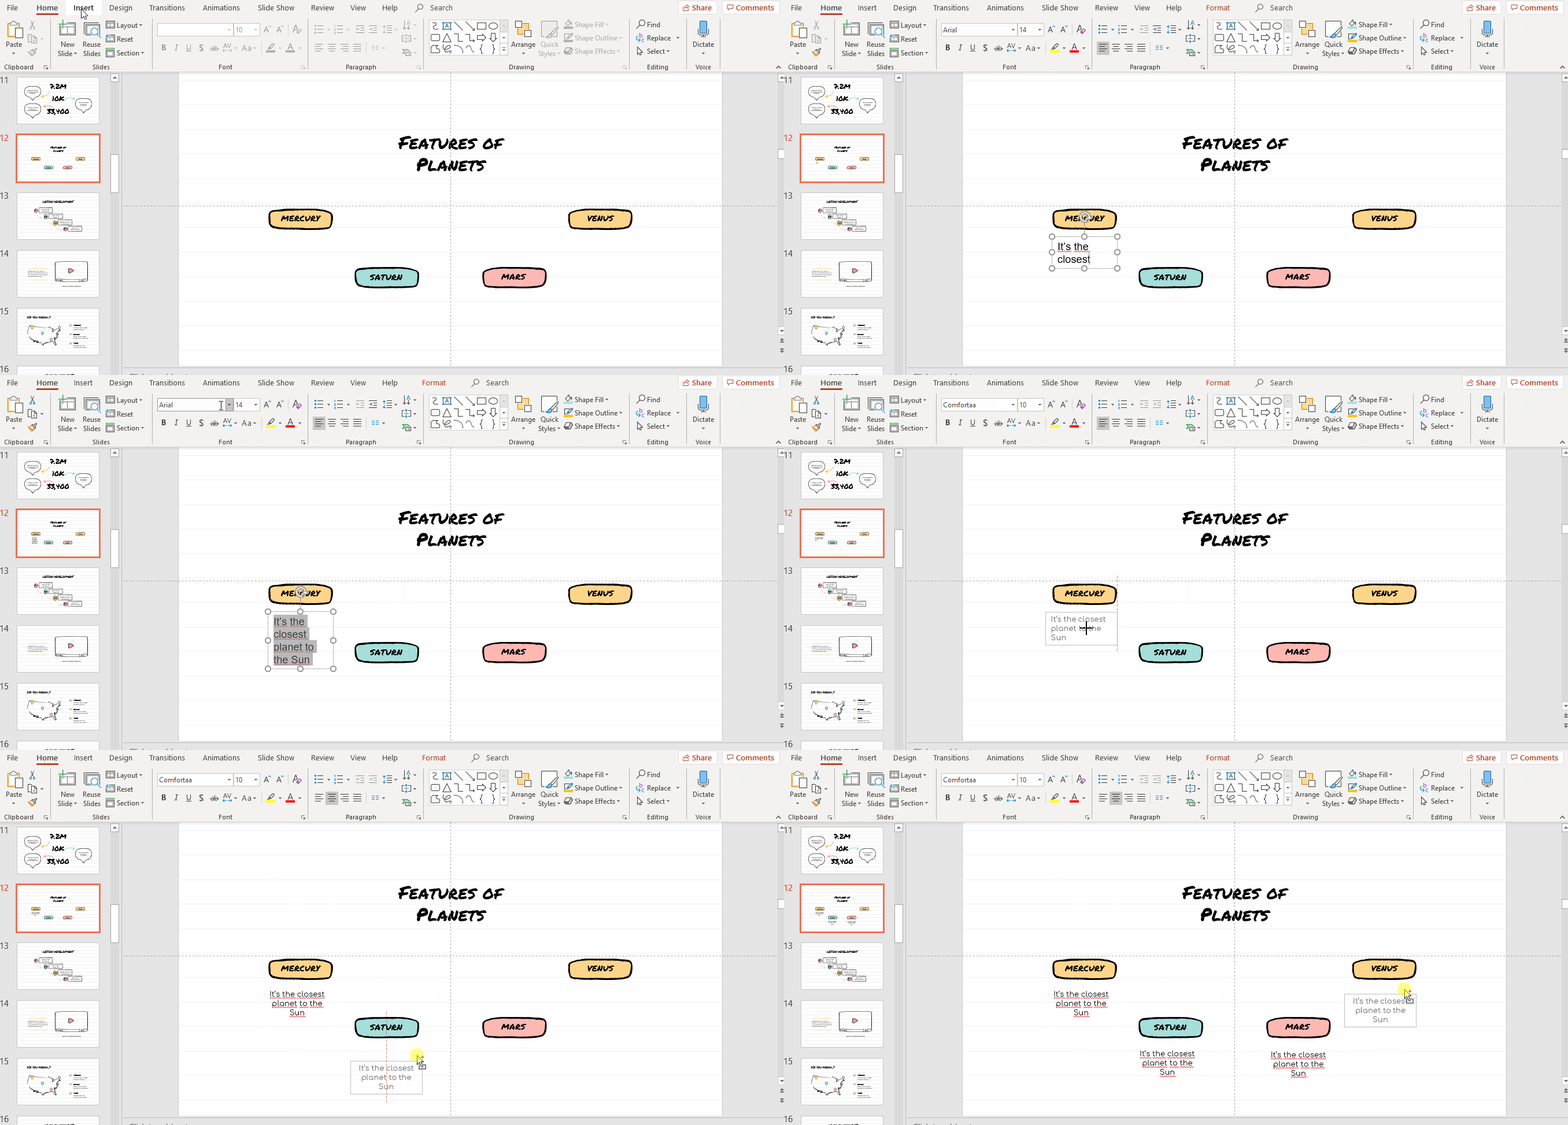
Perfect! The text step is to make a graphic connection between the branches and the main idea. We’ll also add some other elements to create a killing mind map.
Editing the style and adding icons in mind maps
You want to create a mesmerizing mind map, for sure. But you need to take into account adding a color code for your concepts, great fonts, icons or drawings and connectors. Let’s see how to finish your mind map:
- To make it visually appealing, we're going to insert a speech bubble above each keyword. In the toolbar, click on Insert → Shapes → Callouts. Select the one, click and draw to create it.
- As we have four branches, we need four speech bubbles. To duplicate a shape, click on it while pressing Ctrl (or ⌘ if you are using Mac). Modify their colors with the features Shape Fill, Shape Outline and Shape Effects in the toolbar.
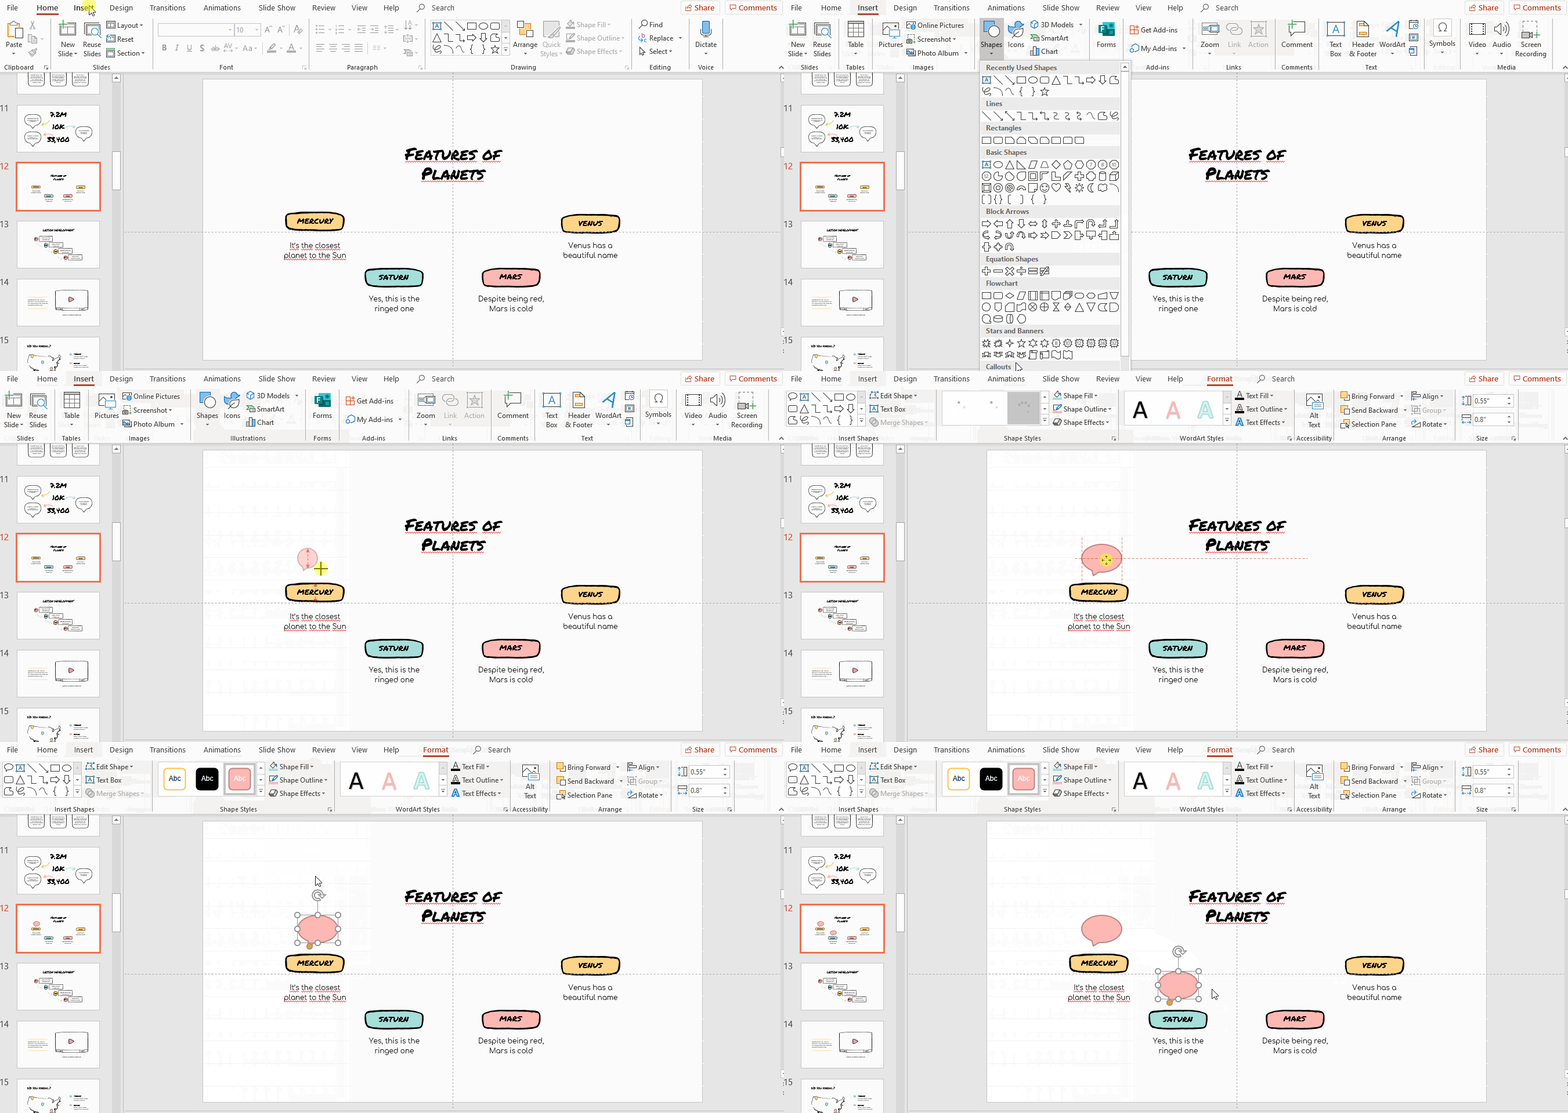
Pro tip: if you keep Shift pressed while you make the shape bigger or smaller, it will keep its proportions.
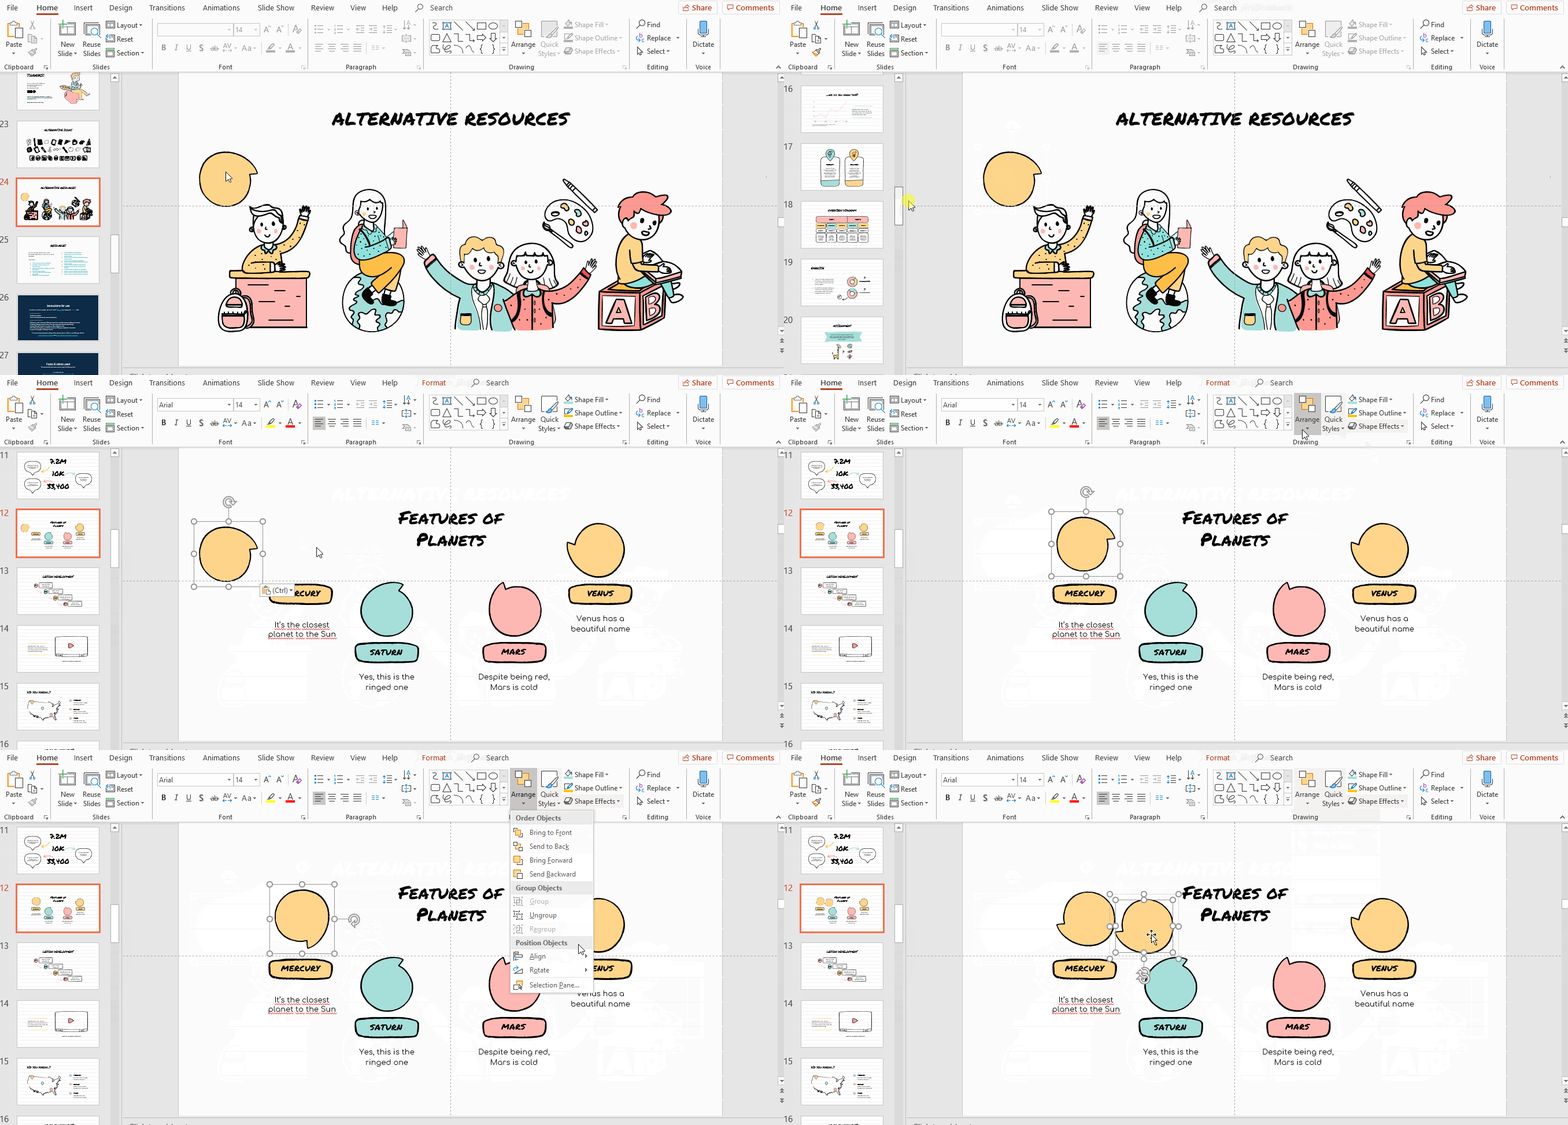
- Did you like the design of the template illustrations? Then you could use one of the shapes included within our template. Go to the alternative resources slide, select the one, click on it and then press Ctrl+C or ⌘+C in Mac.
- Paste it in the mind map slide pressing Ctrl+V or ⌘+V in Mac to paste it. To duplicate it, click on it while pressing Ctrl or ⌘ in Mac. Change its color and style if necessary.
- If you want to rotate the shape, click on Arrange in the toolbar. Then, select Rotate and choose one of the options.
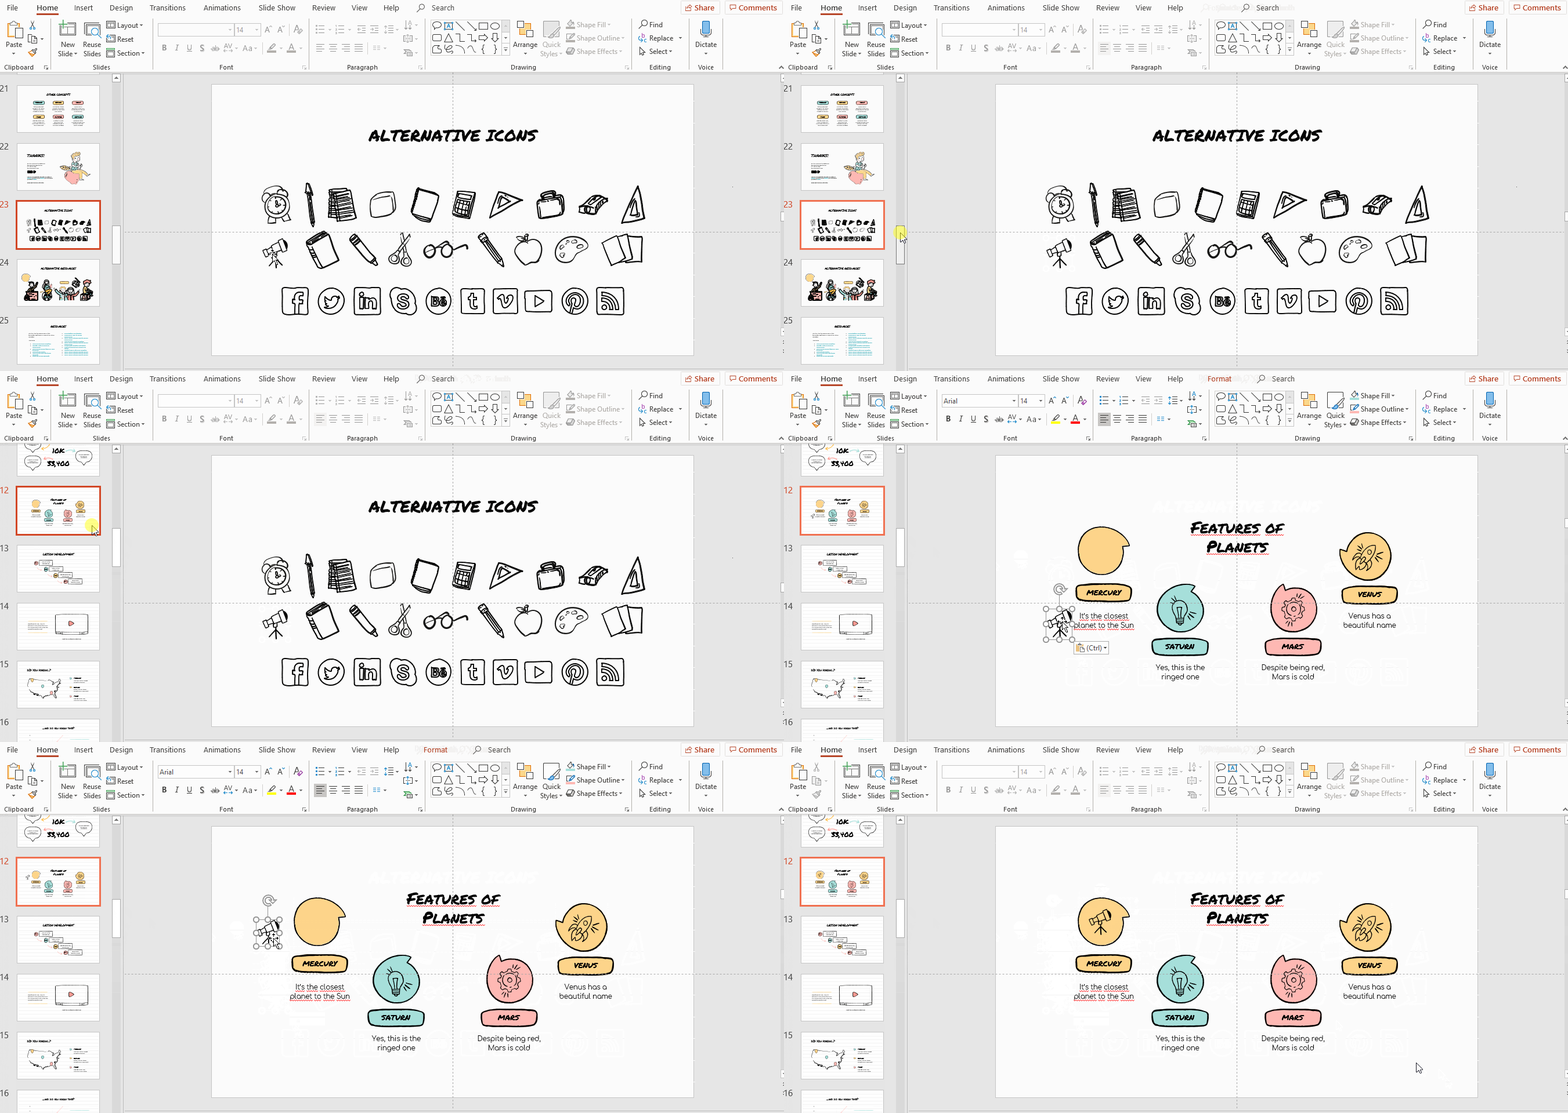
- Now let’s make the speech bubbles more visually appealing with some icons. It will allow you to make a connection between the keyword and the image. Go to the alternative icons slide and select one. Press Ctrl+C or ⌘+C in Mac to copy it.
- In the mind map, press Ctrl+V or ⌘+V in Mac and place the icon in the speech bubble. To know more about how to add and modify icons, you could read this tutorial.
- The last step is to connect the branches with the central idea. Let’s add some arrows from the alternative resources slide. Copy one you like pressing Ctrl+C or ⌘+C in Mac.
- Press Ctrl+V or ⌘+V in Mac to paste it. To duplicate it, click on it while pressing Ctrl or Cmd, ⌘, in Mac.
- Change its colors and styles using Shape Fill, Shape Outline and Shape Effects in the toolbar.
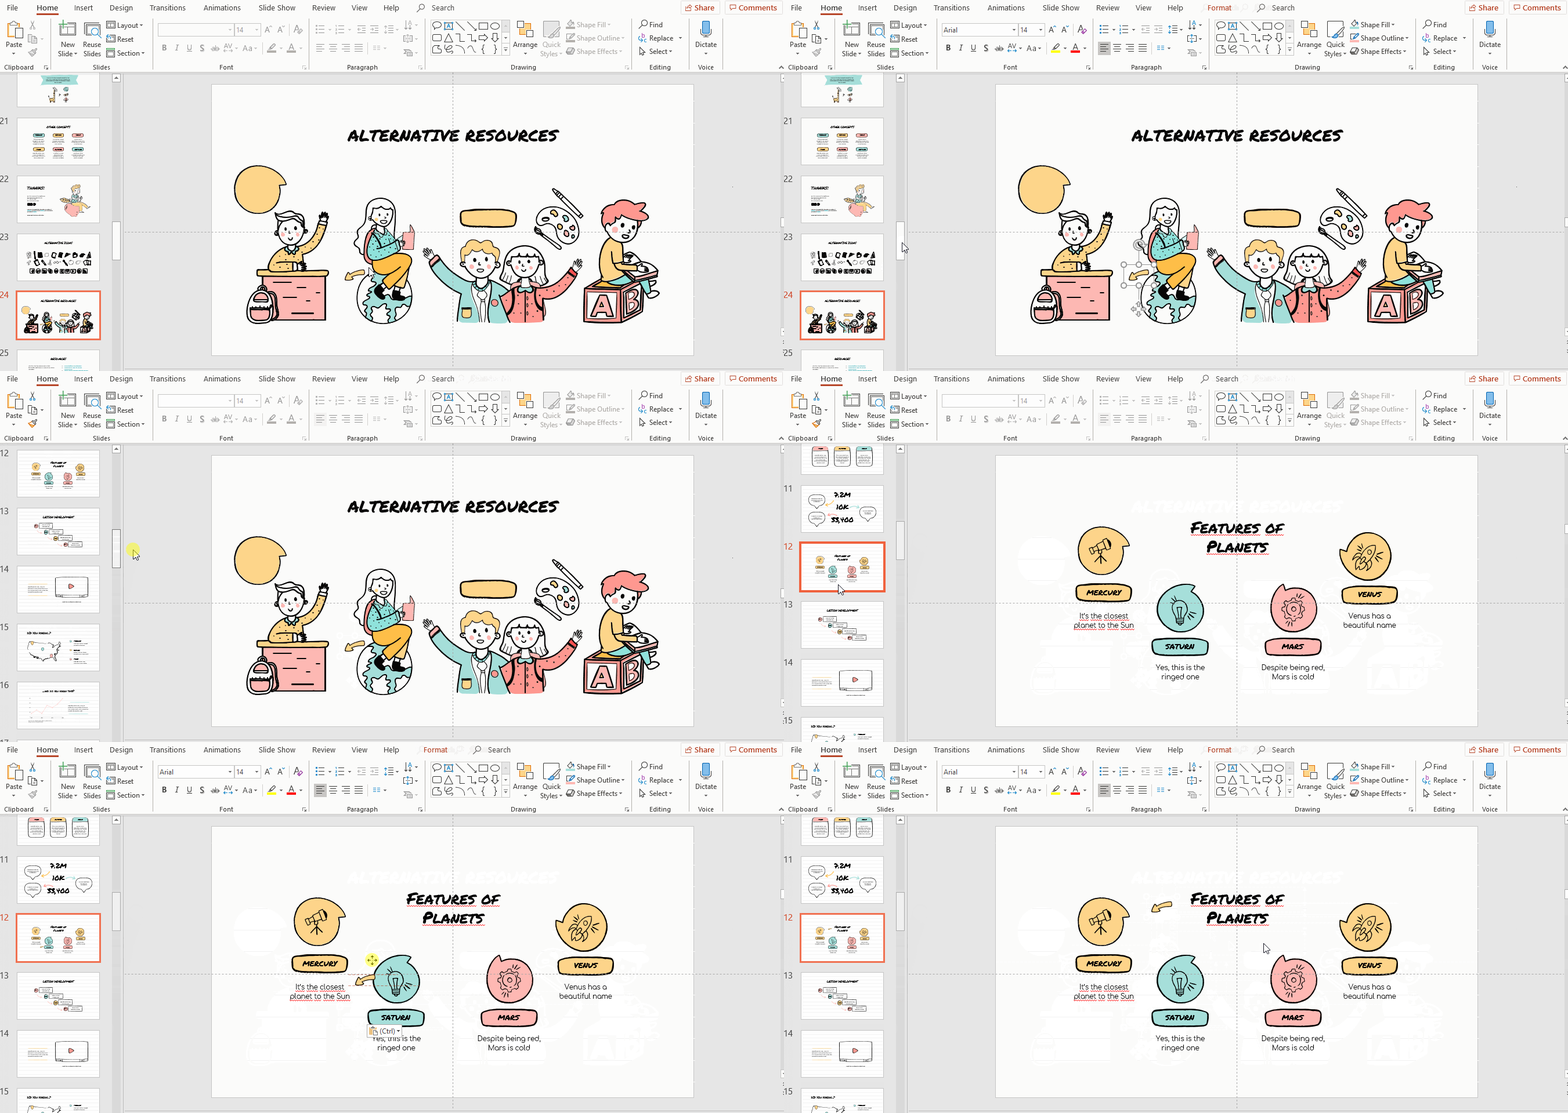
- In case you prefer adding some of the lines or arrows offered by PowerPoint, click on Insert → Line if you want to add this sort of connector. Select one.
- Instead, if you prefer an arrow, click on Insert in the toolbar. Then click on Shapes → Block Arrows and click on one of them.
- Click close to the main idea and drag until the point in which you want the arrow or line to end.
- Click on Shape Outline to change the color. If you need another effect, choose Shape effects.
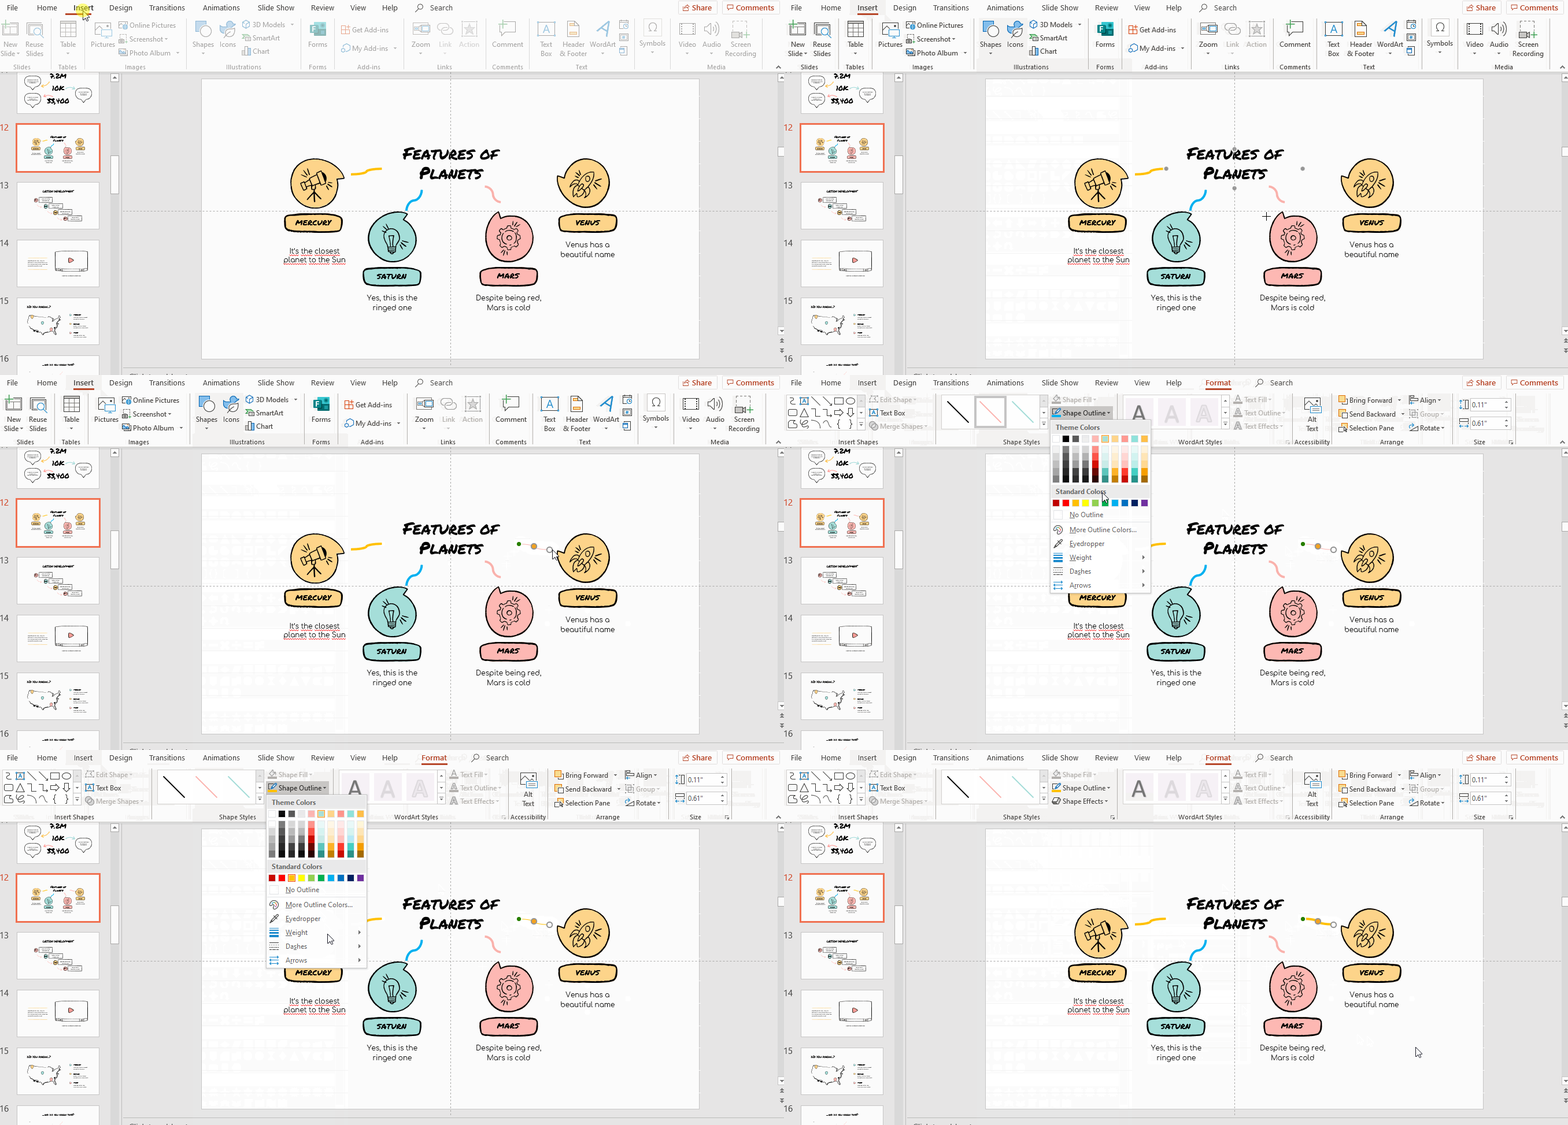
Pro tip: instead of choosing straight lines and arrows, use curved ones. They are brain-friendly!
Your mind map is ready! We have used the Sketchnotes Lesson theme for this tutorial, but you can get many other templates for free! Give them a shot!
Do you find this article useful?
Related tutorials

How to present survey results in PowerPoint or Google Slides
A survey is a technique that is applied by conducting a questionnaire to a significant sample of a group of people. When we carry out the survey, we start from a hypothesis and it is this survey activity that will allow us to confirm the hypothesis or to see where the problem and solution of what we are investigating lies.We know: fieldwork is hard work. Many hours collecting data, analyzing and organizing it until we have our survey results.Well, we don't want to discourage you (at Slidesgo we stand for positivism) but this is only 50% of the survey work....

How to Create a Venn Diagram in Google Slides
If you wish to give an awesome presentation, using diagrams is great because they make your data look nicer and help your audience understand your points.In this Slidesgo School article, we’ll teach you how to create Venn diagrams in Google Slides so you can have them in your bag of resources!

How to Create a Venn Diagram in PowerPoint
How many times did you have to explain your data with a PowerPoint presentation and you weren’t able to find the most visual way to do it? To help you with this matter easily and quickly, in this Slidesgo School post we will explain how to insert or create a Venn diagram in PowerPoint, as well as its history and components.

How to add and edit maps in Google Slides
Map infographics are very useful for any presentation, as they allow you to transmit data quickly and easily. In this post we are going to explain how to include and edit maps in your Google Slides presentations.
