
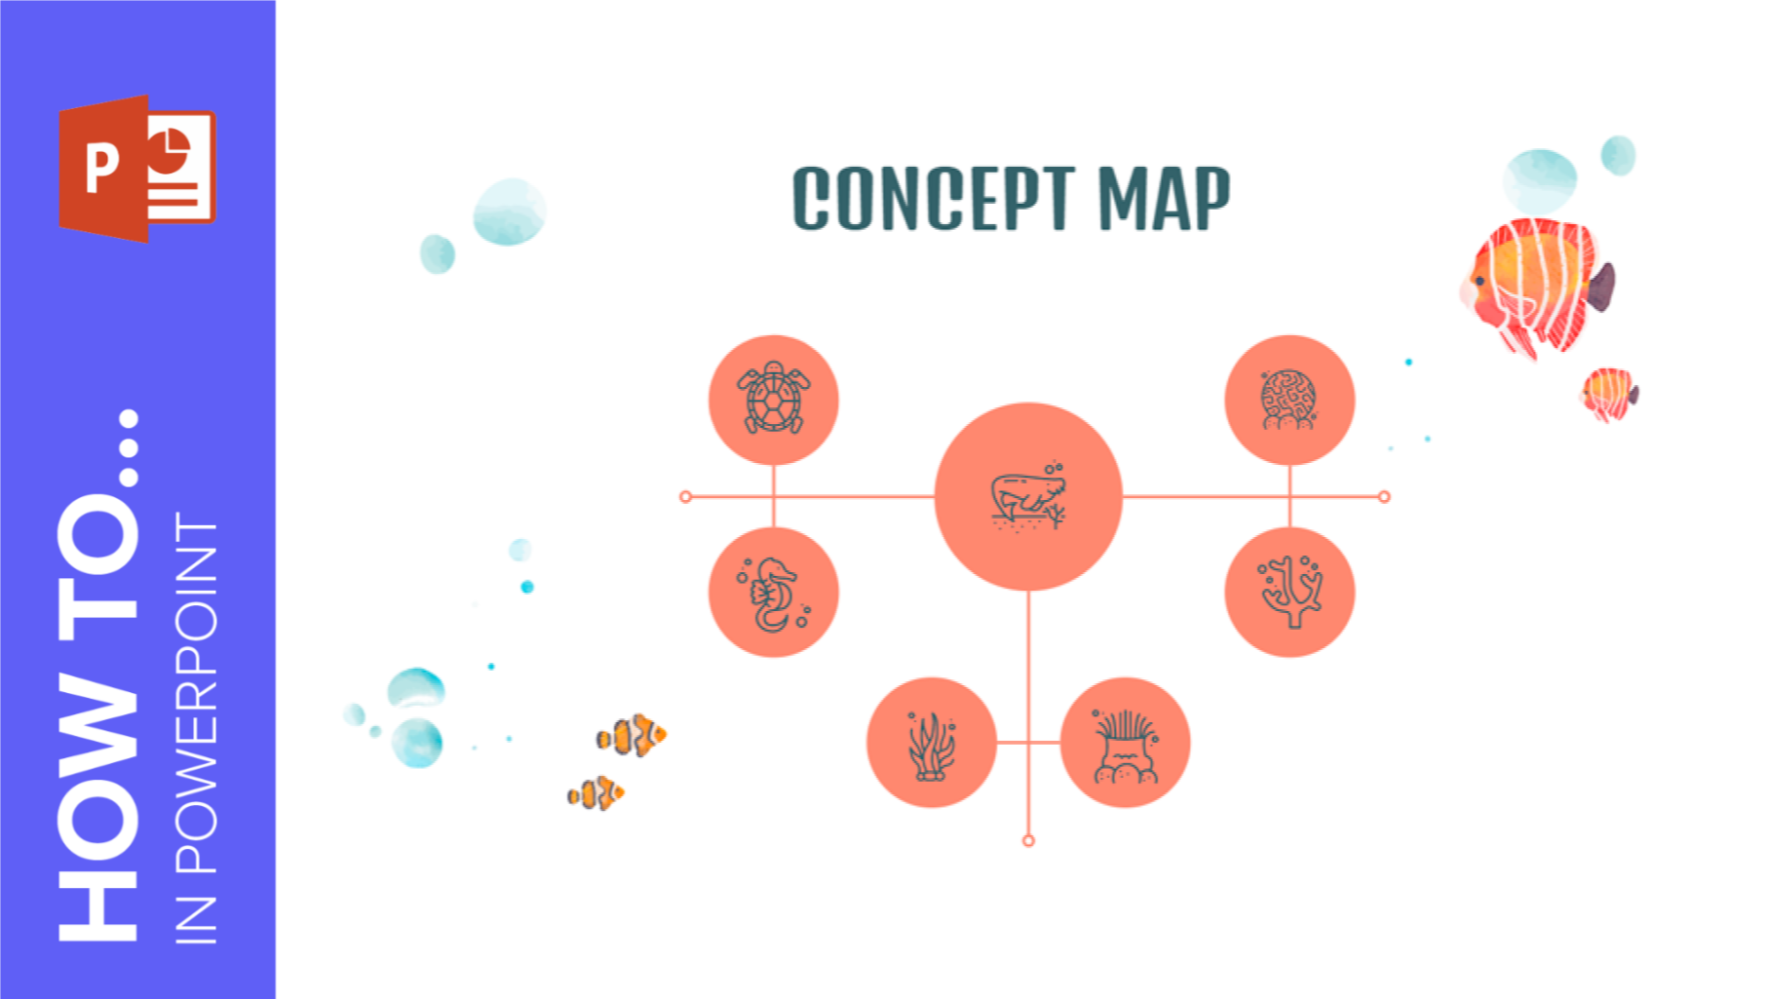
How to Make a Concept Map in PowerPoint
It’s estimated that 65 percent of humans are visual learners. That goes without saying that it is often easier to explain complicated concepts with visual aids than text. That’s where a concept map comes into play. In this Slidesgo School tutorial, we’ll teach you how to make a concept map in PowerPoint.
During a presentation, you only have that much time to capture and maintain your audience’s attention and complicated ideas can be hard to explain. Concept maps help to visualize information, which makes it easy to consume. In simple terms, concept maps are diagrams that portray the relationship between various ideas.
Creating the main concept or idea
- Open your PowerPoint presentation.
- Go to the slide you want to create the concept map in.
- Select Oval in the Drawing section and drag it out to create a circle. This will represent the main idea of your concept map. For proper alignment and placement, use the vertical line running across the slide as reference and support.
Pro tip: Hold Shift while dragging to create a nicely rounded circle.
- Style your circle with the options Shape Fill and Shape Outline. For a smooth look, stick with theme colors and make the circle's borders transparent by selecting Shape Outline and choosing No Outline.
Creating related concepts (nodes)
- Select the circle to copy and paste it (Ctrl + C and Ctrl + V).
- To edit its size, hover your cursor over any of the dots located in the four corners.
- You’ll see that your cursor will become a double-headed arrow. That’s an indication that you can resize your circle.
- Click on the dot and drag it inwards to make the circle smaller. A concept map portrays hierarchy and the relationship between elements. We want to introduce secondary concepts so we’ll be creating smaller circles.
- Position this new circle below the main circle. Well done, you’ve created the first secondary concept (also known as a node).

- Copy and paste the smaller circle to create additional related nodes.
- Move the second node slightly above the main idea using PowerPoint’s visual guides (in this case, red lines) to help you align objects.
Pro tip: PowerPoint’s guidelines include an option to place multiple objects at the same distance from one another. This is indicated with a red double arrow. Use it to make sure nodes are properly aligned and equidistant in relation to the main concept.

- To replicate more nodes in one go, group them together: Select the two elements by clicking and dragging out the area around them and then select Arrange → Group (in Drawing). Any edits done from this point on will be applied to both at the same time.

- Copy and paste the two nodes and place them on the other side of the main concept. Mirror images are a great way of creating visual balance.
Pro tip: Continue using PowerPoint’s visual guidelines to place the second pair of nodes at equidistant from the main circle as the first pair. Remember to look out for the red double-headed arrows.

- Replicate the grouped nodes one final time to create the last pair of nodes you’ll need for the concept map.
- Rotate them to place them horizontally underneath the main concept. Do this by selecting Arrange → Rotate → Rotate Right 90º.

Pro tip: There’s an easier way to rotate objects. Click on the pair of grouped nodes to bring up a circular arrow at the top of the node. Click and drag this arrow to rotate the object. Holding down Shift while rotating helps to rotate the object in 15-degree increments so you’ll need to rotate it six times for a 90º rotation.

Connecting related concepts
- To start connecting ideas, select Line from the shapes box in Drawing. Click and drag while holding down Shift to create a perfectly straight line.
- Place it right in the middle of the main circle.
- Click on Shape Outline to style your line by editing its line weight and color (we recommend that you continue using the themes’ color palette for consistency). By default, lines created in PowerPoint’s are pretty thin, so increase its weight to boost its visibility.

- To connect your main and secondary ideas (or nodes), create new lines. You’re now seeing your concept map starting to come together. These lines represent a relationship between the main and secondary ideas.
- Use lines to connect secondary ideas if they are related in terms of concept. For example, in this concept map, the nodes in each pair are related, so we’ll go ahead and create lines to connect the two.

Adding titles to the nodes
- If you want to label the nodes, double click on the circle and start typing.
- Style the text by selecting it to display style options (Font, Font Size, Font Color, Alignment, etc.) and formatting options (Bold, Italic, Underline).
- Remember to keep your text centralized for a better look. Remember to maintain the color and style of the slides’ theme to produce a more consistent presentation.
Adding descriptive texts to a concept map
- To add text, click on the Insert in the menu bar and select Text Box. Click and drag to create a text box.
- Write your text. You can either describe the relationships between the nodes or provide more context.
- You may style your text as you wish. We recommend that you stick to the slides’ main colors and fonts as much as possible. Try to keep your text short and sweet. Having too much text can destroy a concept map.

- To add more text boxes, you can simply copy and paste the one you’ve already created. In this concept map, we’ll need three for the concept’s three main relationships.
- You may also fiddle around with the text box alignment. You can align the text box on the sides of the concept map to the left and right, while having the text box at the bottom centralized.
Adding visual details to a concept map
If you wish to use other icons, you may download them from Flaticon. After saving them, select Insert → Pictures to browse and import them into your presentation.
Next, resize the icons to the desired size and position them in circles.
Related tutorial: How to add and modify icons in PowerPoint
Pro tip: You may find a whole variety of extra icons in all of Slidesgo’s PowerPoint templates. They are located after the Thank you slide of each template.
- Open any of our PowerPoint templates and go to the icons slide.
- Copy (Ctrl + C) the icon you want to use.
- Return to the slide you want to paste your icon on (Ctrl + V).
- Resize the icon by dragging its corner either inwards or outwards. Just like you did with the circles, hold down Shift to maintain the icon’s proportion.

- To change the icon’s color, select the icon and click on Shape Fill or Shape Outline in the Drawing section.
- You’re now at the last step. To finalize the concept map, copy and paste (Ctrl + C and Ctrl + V) the other icons you’d like to use. We recommend that you continue using the slides’ main theme colors and style. Also make sure to position icons in the middle of the circles for a cleaner look by using PowerPoint’s visual guidelines.
Related tutorial: How to Arrange and Align Elements in PowerPoint
Thttps://slidesgo.com/themeshere you have it: a concept map created from scratch! While this was straightforward to create, you can also use Slidesgo’s ready-made templates that you can customize and edit. Here are some of our most popular designs.
Do you find this article useful?
Related tutorials

How to present survey results in PowerPoint or Google Slides
A survey is a technique that is applied by conducting a questionnaire to a significant sample of a group of people. When we carry out the survey, we start from a hypothesis and it is this survey activity that will allow us to confirm the hypothesis or to see where the problem and solution of what we are investigating lies.We know: fieldwork is hard work. Many hours collecting data, analyzing and organizing it until we have our survey results.Well, we don't want to discourage you (at Slidesgo we stand for positivism) but this is only 50% of the survey work....

How to Create a Venn Diagram in Google Slides
If you wish to give an awesome presentation, using diagrams is great because they make your data look nicer and help your audience understand your points.In this Slidesgo School article, we’ll teach you how to create Venn diagrams in Google Slides so you can have them in your bag of resources!

How to Create a Venn Diagram in PowerPoint
How many times did you have to explain your data with a PowerPoint presentation and you weren’t able to find the most visual way to do it? To help you with this matter easily and quickly, in this Slidesgo School post we will explain how to insert or create a Venn diagram in PowerPoint, as well as its history and components.
How to add and edit maps in Google Slides
Map infographics are very useful for any presentation, as they allow you to transmit data quickly and easily. In this post we are going to explain how to include and edit maps in your Google Slides presentations.