How to Make a Concept Map in Google Slides

We live in bustling times. Between work, family, social media, etc., our minds can get extremely cluttered. That can make it difficult to focus, especially when there are complex concepts to explain. This is why concept maps play a crucial role in organizing information: They make it easy to digest.
Concept maps are a type of diagram used to explain relationships between ideas visually. They begin with one main idea before connecting it to other smaller yet equally important related ideas. The best part is that you only need a few basic shapes—lines, ovals, and squares—to create a concept map in Google Slides.
Creating the main concept or idea
- Open your Google Slides presentation.
- Go to the slide you want to make the concept map in.
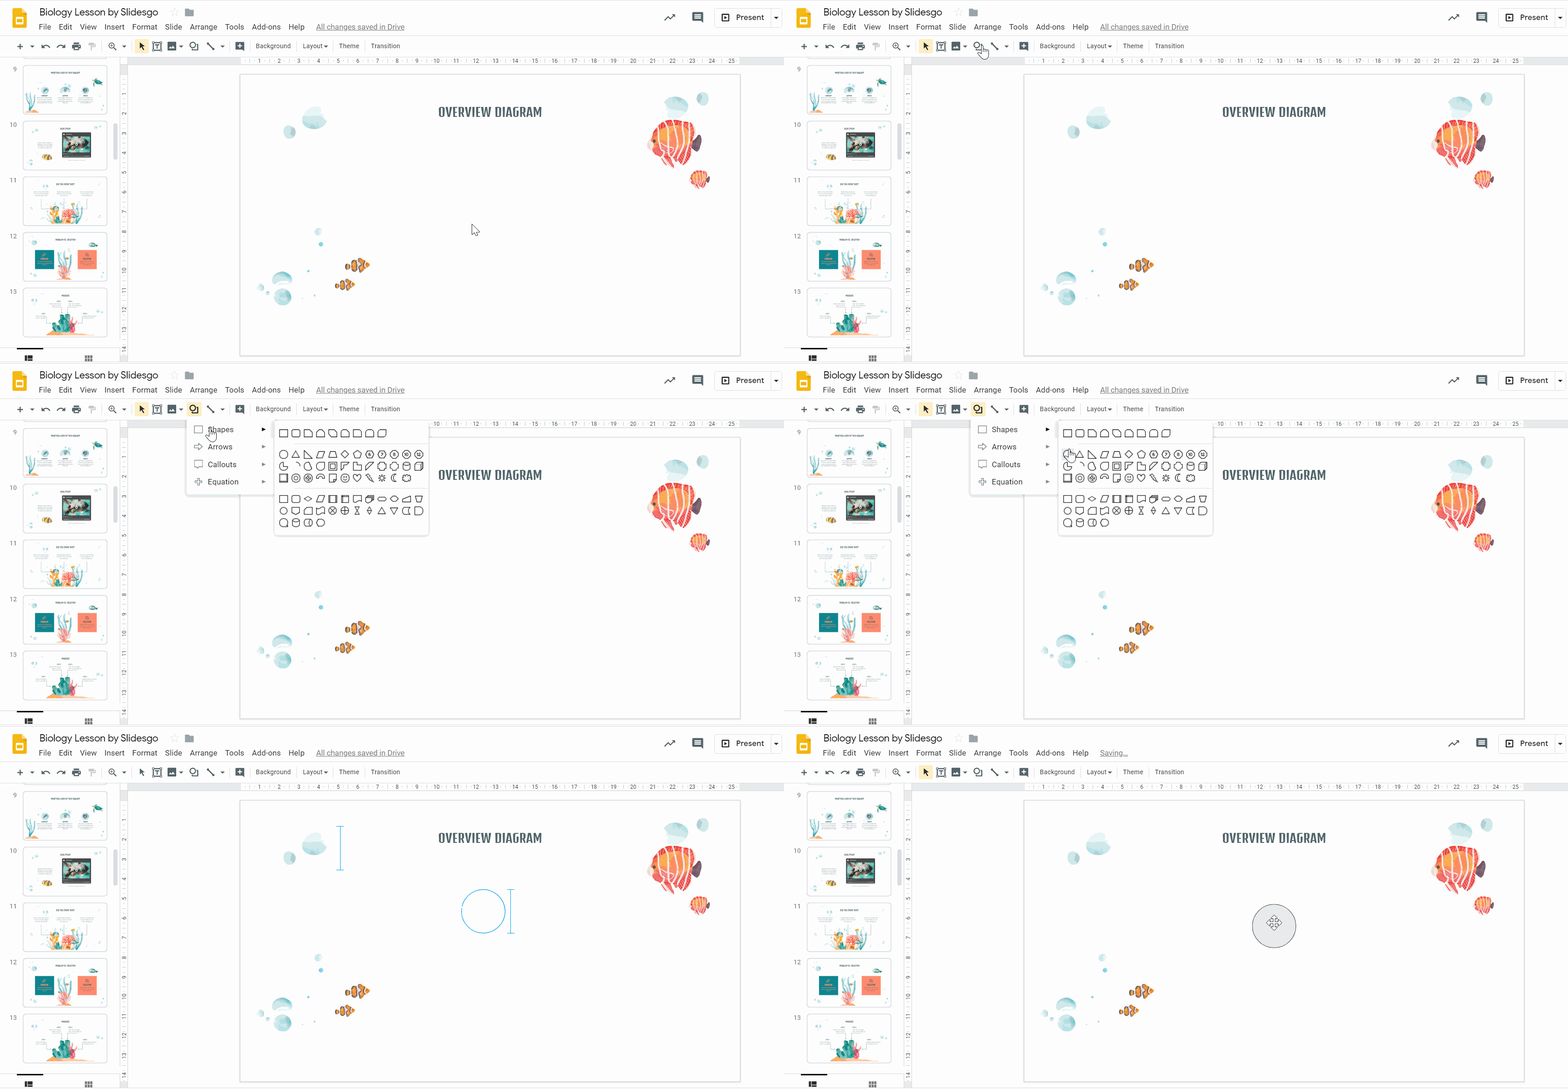
- Go to the toolbar and click Insert → Shape → Shapes. Select Oval and drag it out with the mouse to create a circle. This represents the main idea of your concept map.
Pro tip: Hold on to Shift while dragging to create a perfect circle.
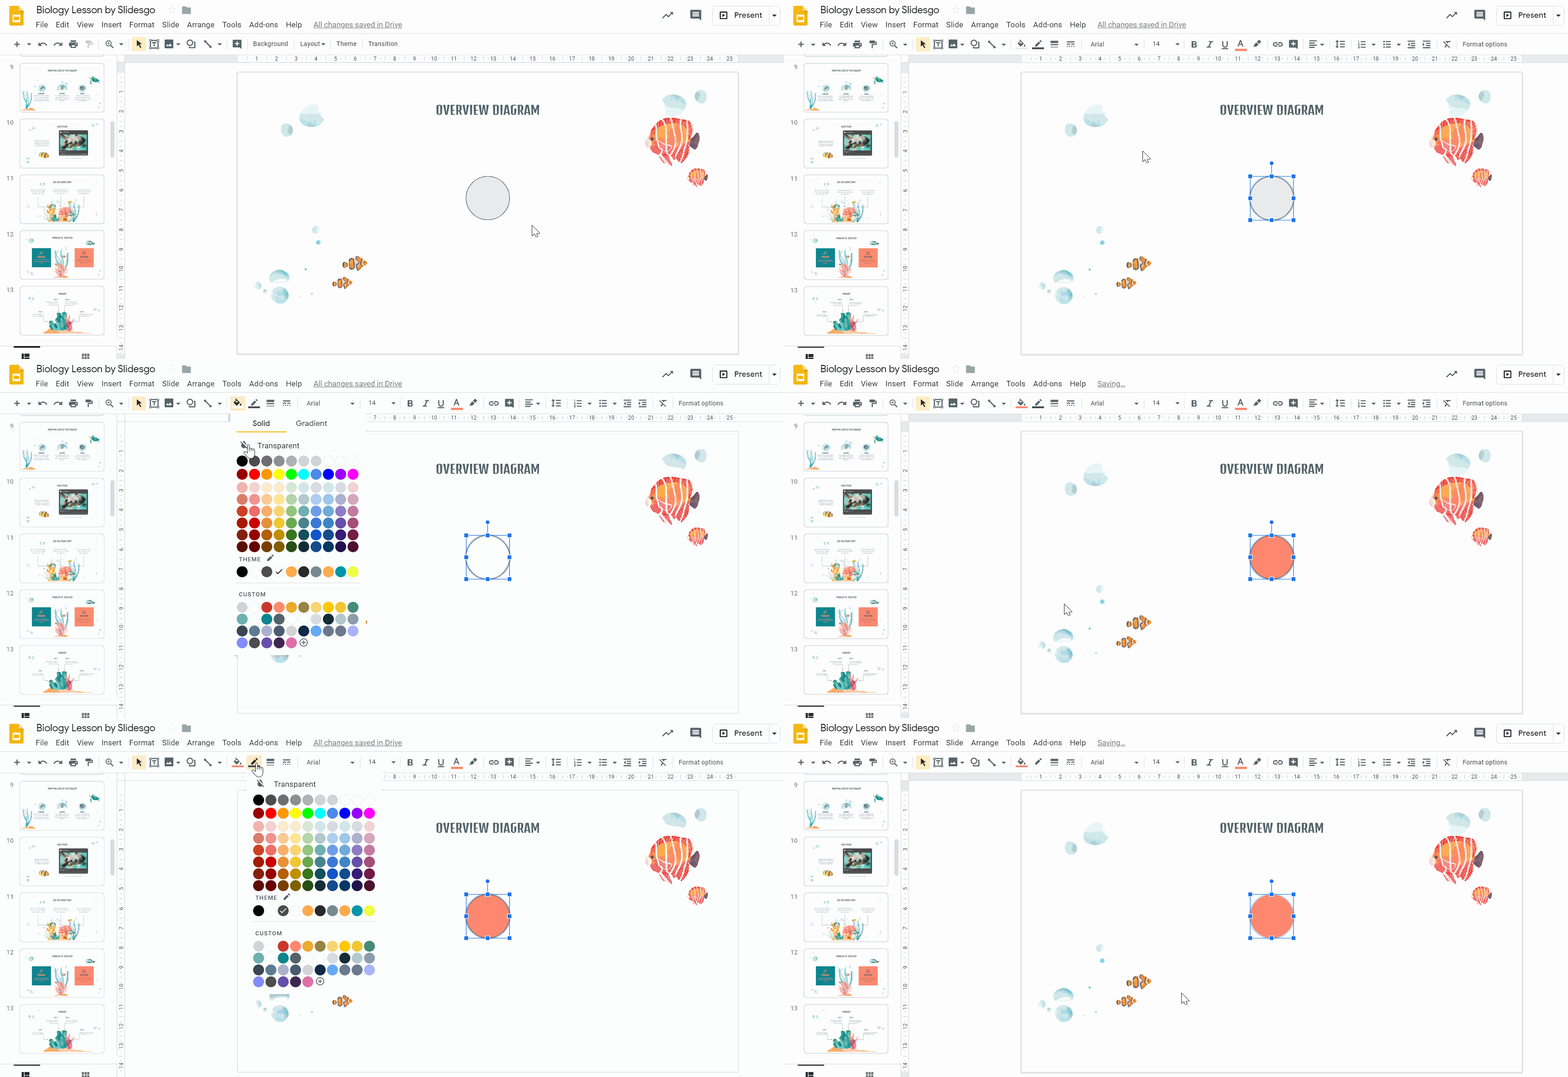
- Style your circle by using the options Fill Color and Border Color. Remember to stick to the slides’ theme colors and select a transparent border for a cleaner and more consistent look.
Adding titles to the nodes
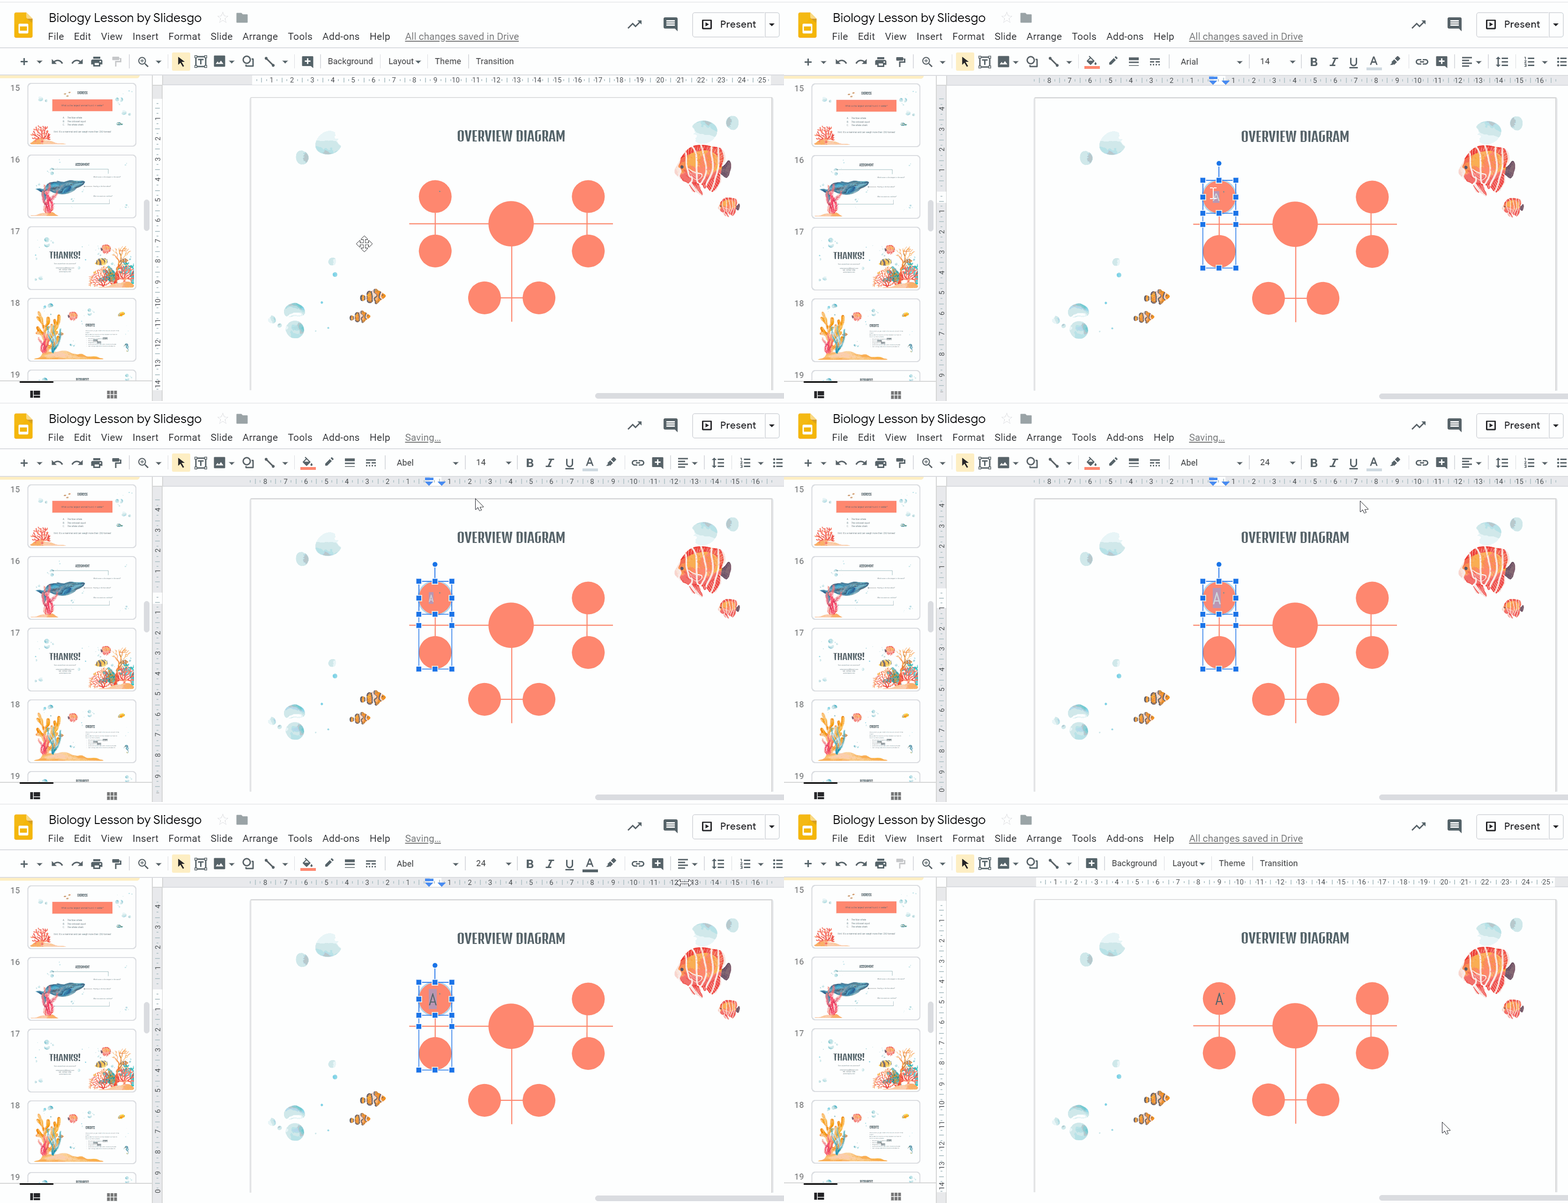
- If you want to label the nodes, double click on the circle and start typing. Style the text by using the options Font, Font size, Text color and Align. Remember to continue using the theme’s font types and colors and make sure the text is centered in the circles.
Adding descriptive texts to a concept map
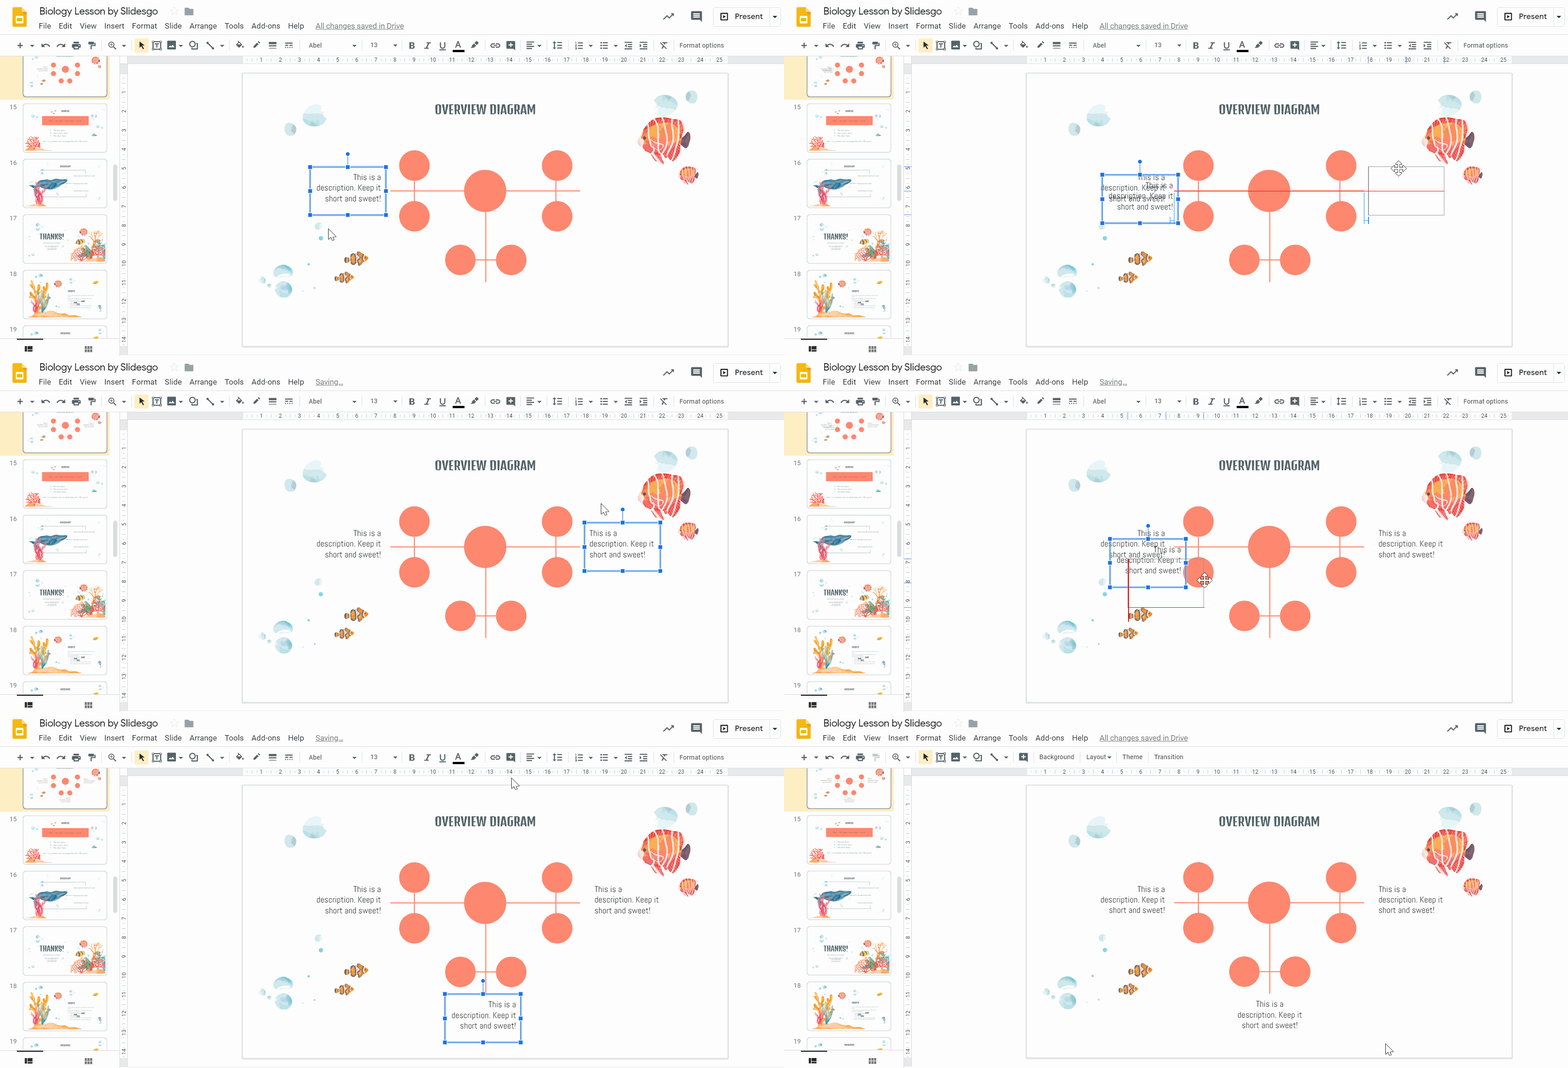
- Click on Insert → Text box. With this text box, you can either describe the relationships between the circles in the concept map or provide more context. Do not divert from the slides’ theme colors and fonts. Also, remember that the concept map is a visual design so refrain from adding too much text to distract your viewers.
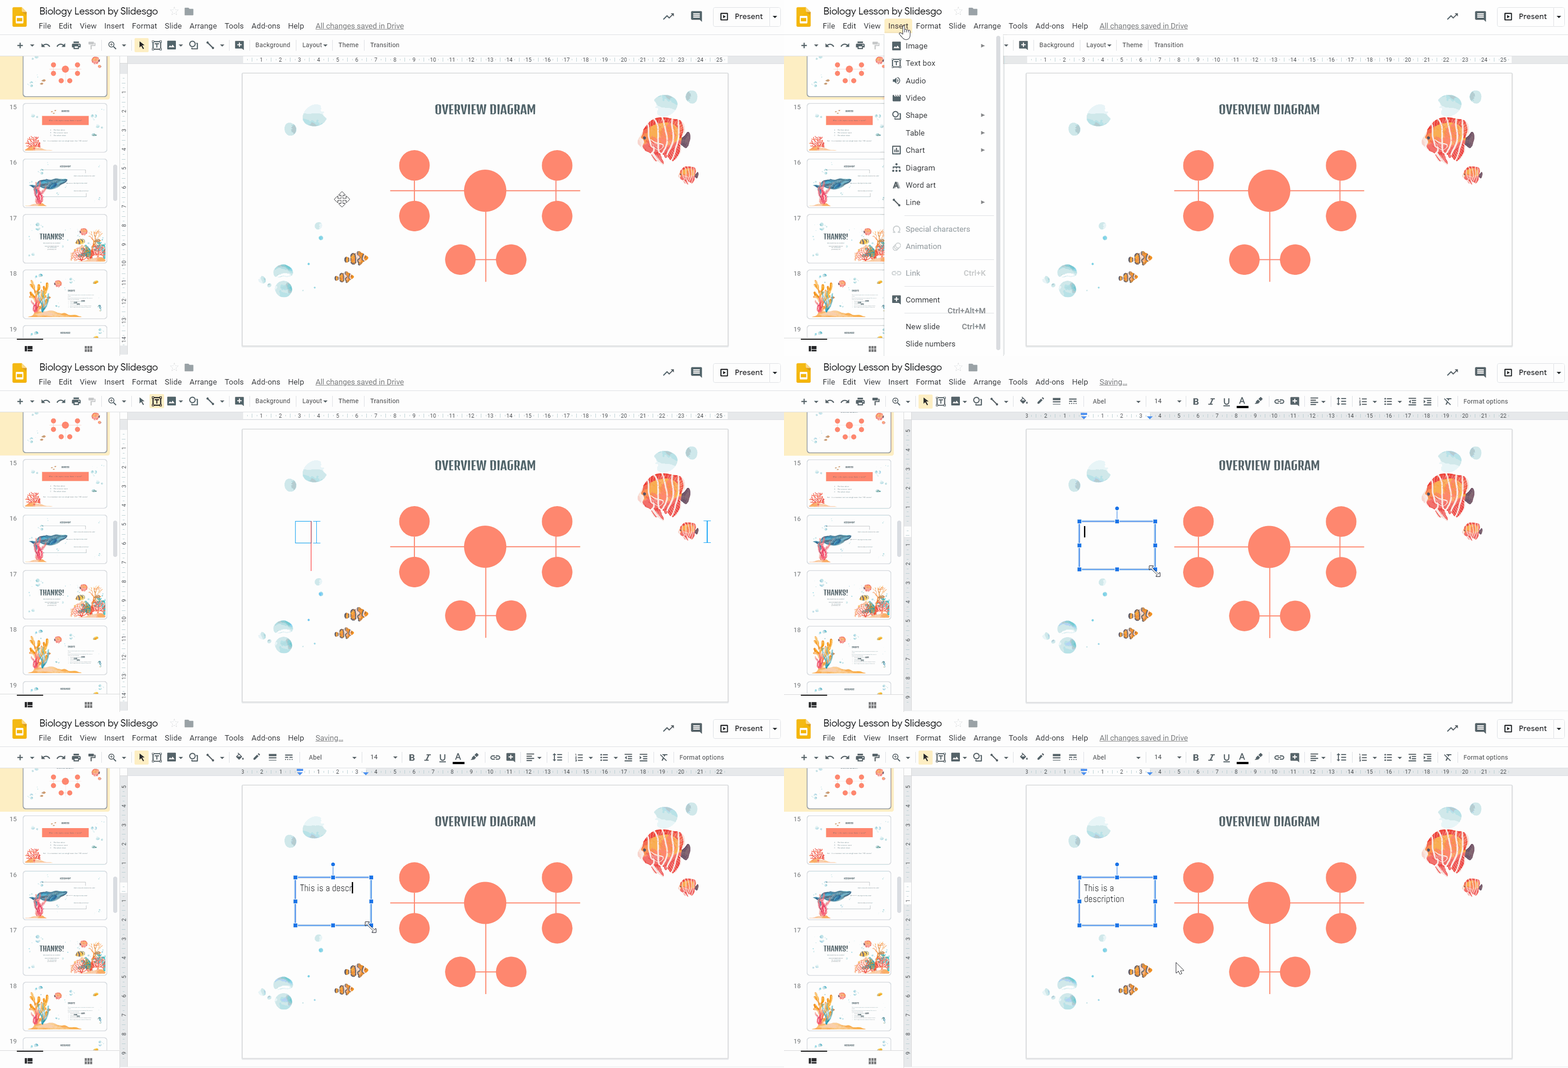
- Copy and paste (Ctrl + C and Ctrl + V) to replicate as many text boxes as you need. In this example, we’ll have three of them to represent the concept’s three main relationships.
- You can also play around with alignment options by selecting Arrange in the menu. You may want to align the text boxes on the side to the left and right and center the text in the text box at the bottom.
Adding visual details to a concept map
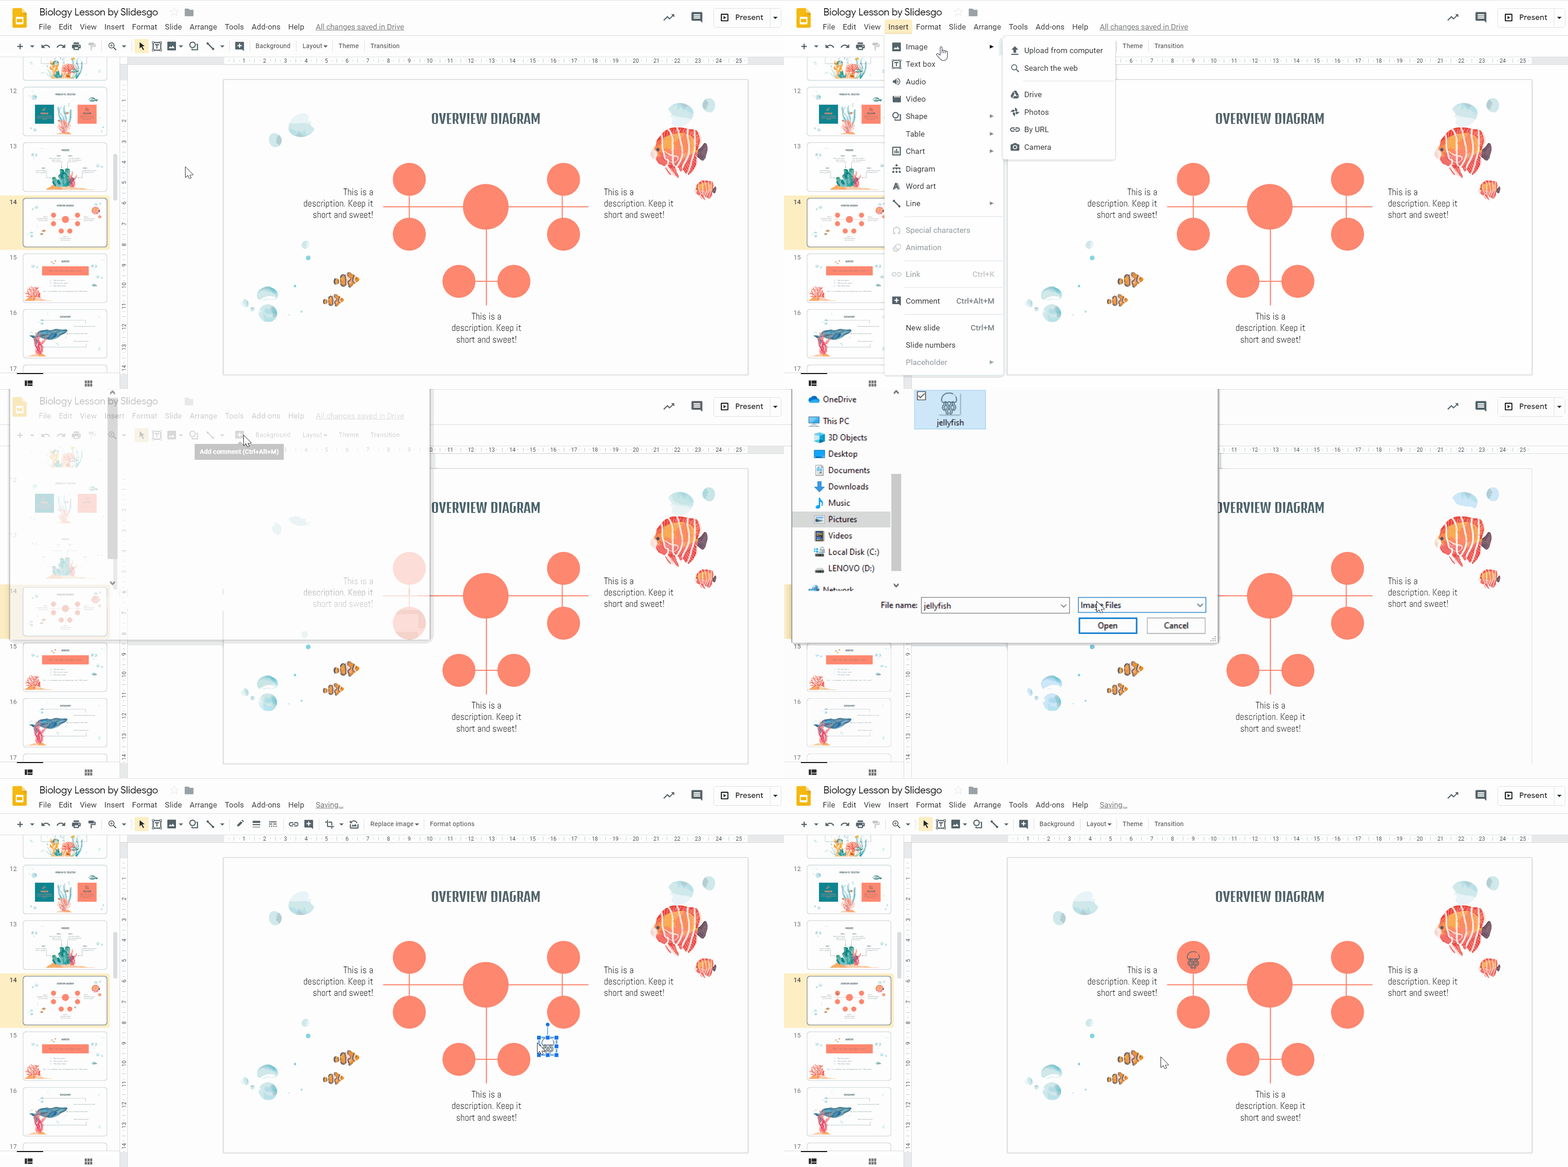
- You can also add icons to your concept map. Google Slides doesn’t have integrated icons. But there are thousands of free icons available on Flaticon. You may download the icons or install the Flaticon extension for Google to access them directly from Google Slides. Once you have them, insert them into your concept map by selecting Insert → Image → Upload from computer.
- Resize the icons as needed and place them in the middle of the circles.
Related tutorial: How to add and modify icons in Google Slides
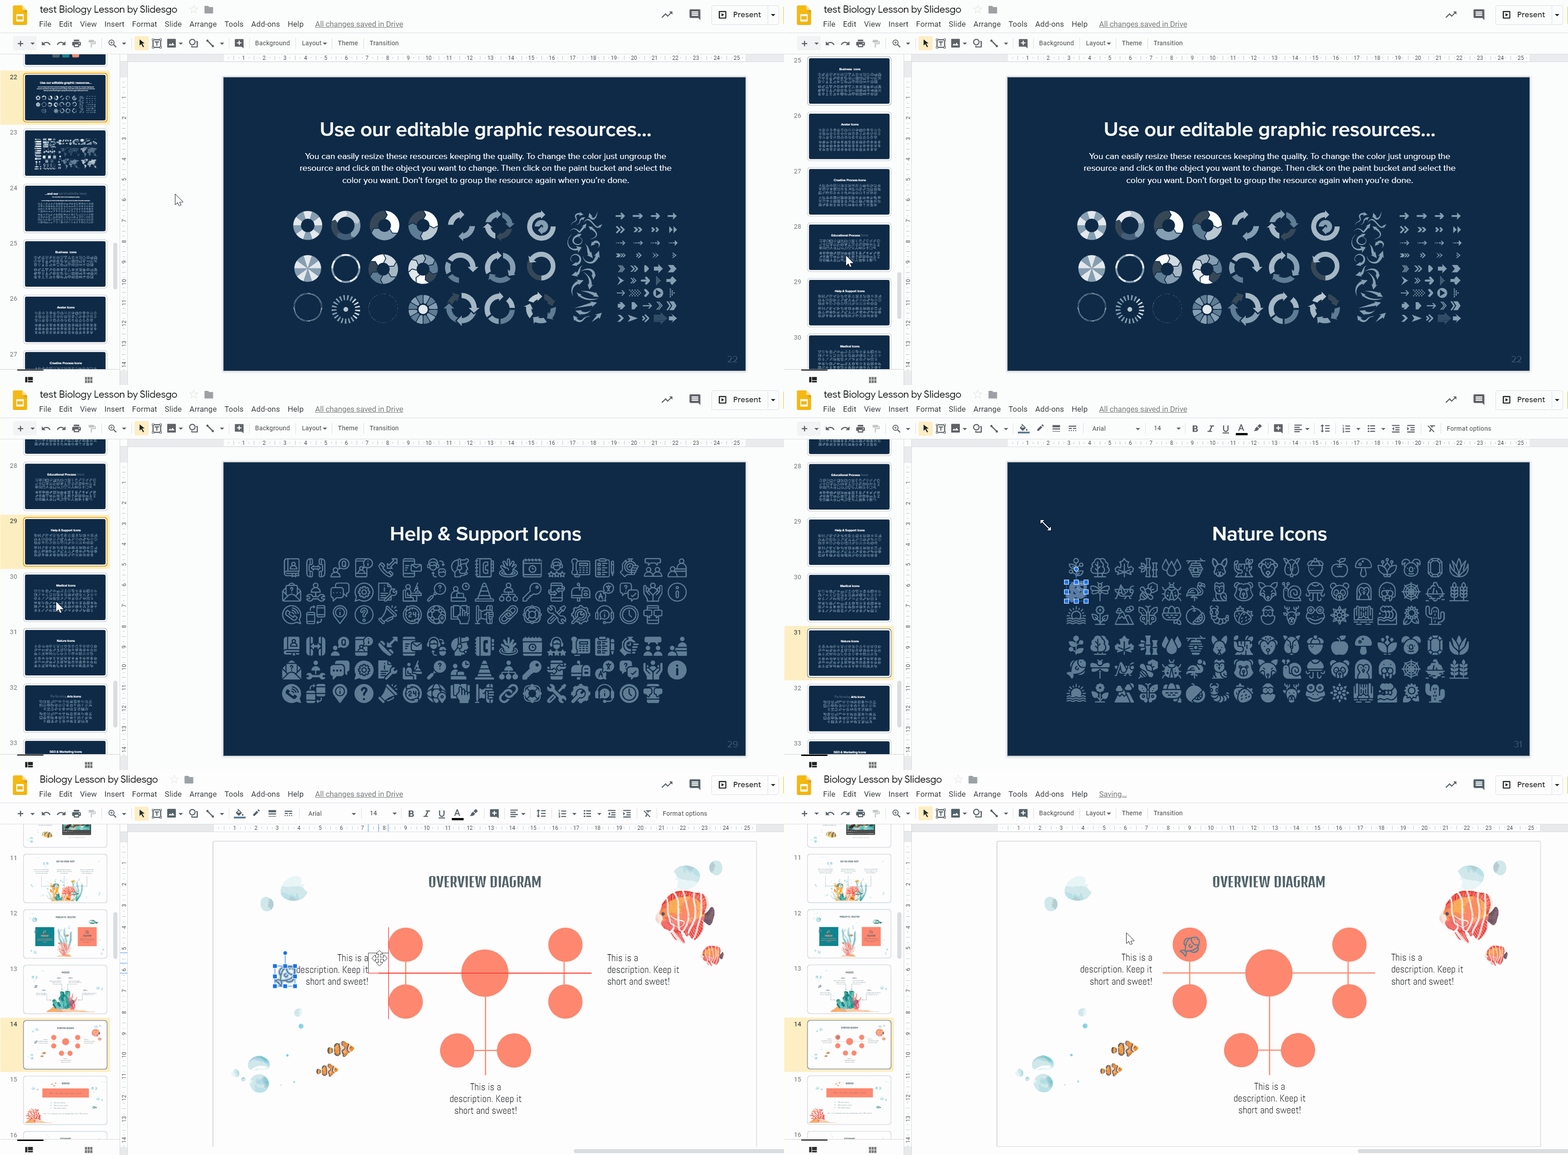
Pro tip: All of Slidesgo’s templates for Google Slides come packed with tons of icons. We’ve included them in the final slides of our templates, right after the Thank you slide. All you have to do is copy and paste the ones you like into your concept map. Plus, they are all 100% editable!
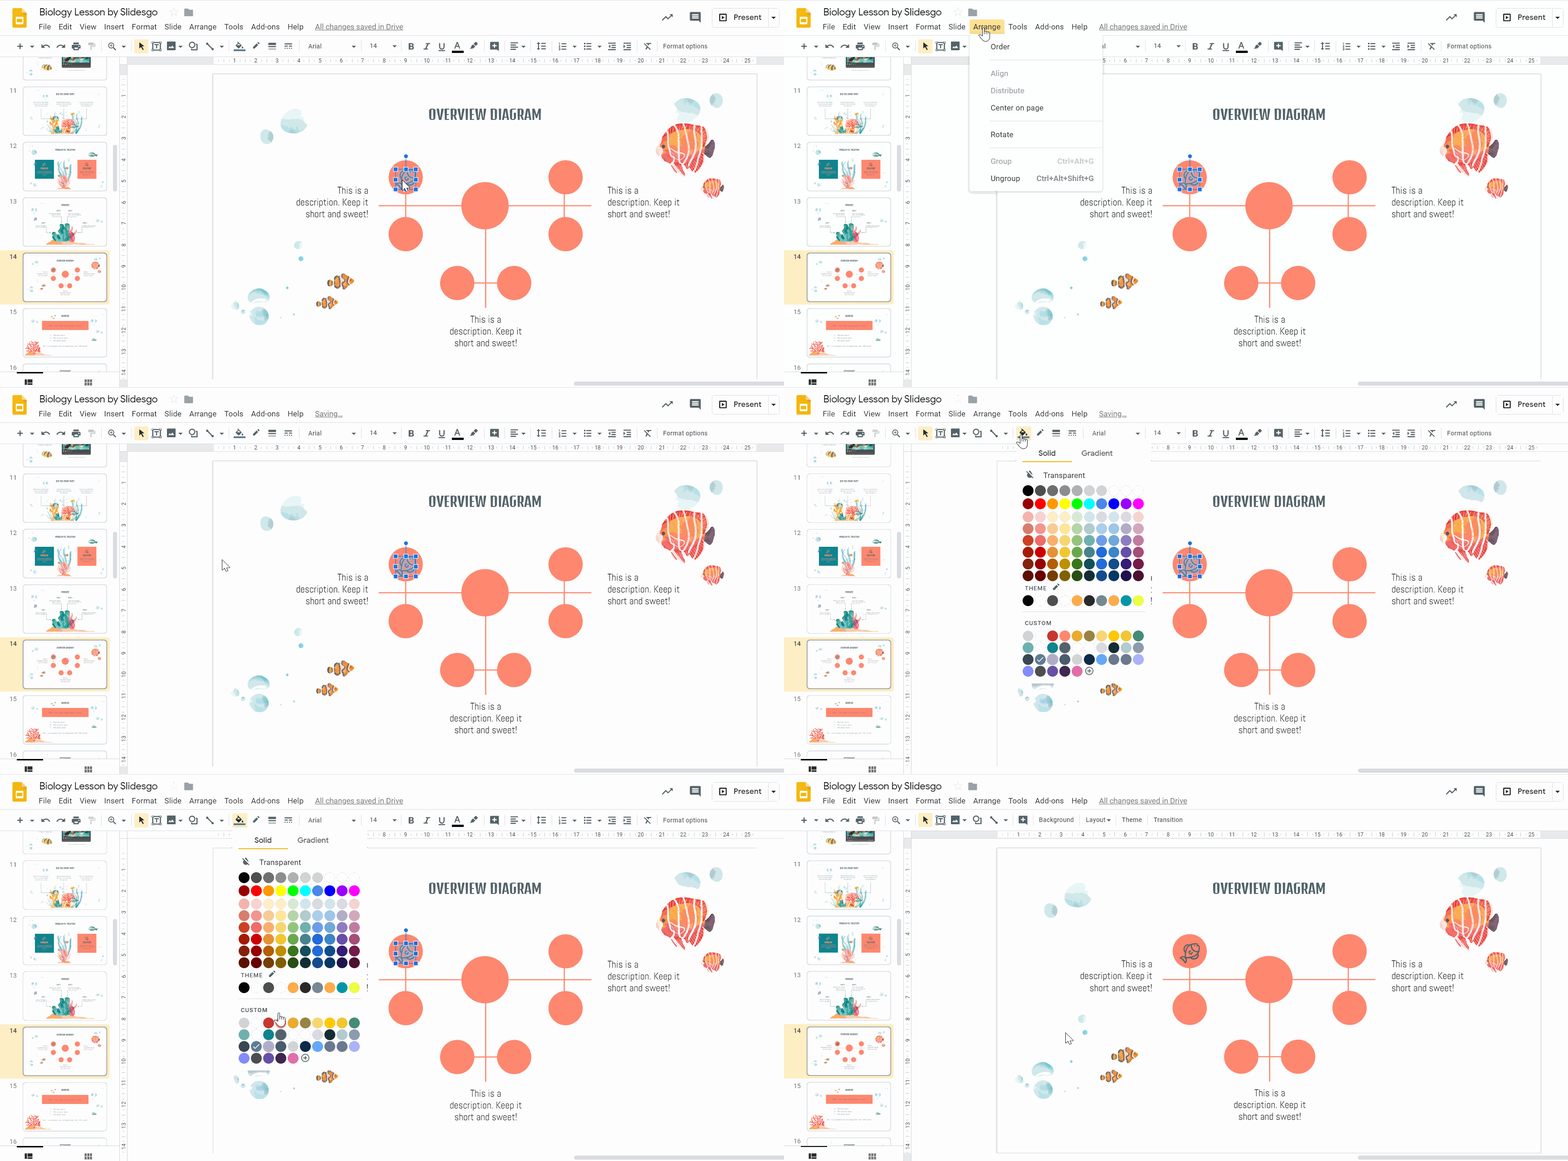
- To change the color of the icon, click Arrange → Ungroup and use the Fill color option.
- Copy and paste all remaining icons to complete the concept map. Again, remember to stick to the slides’ theme colors and make sure icons are placed right in the middle. That’s it: A concept map made easy!
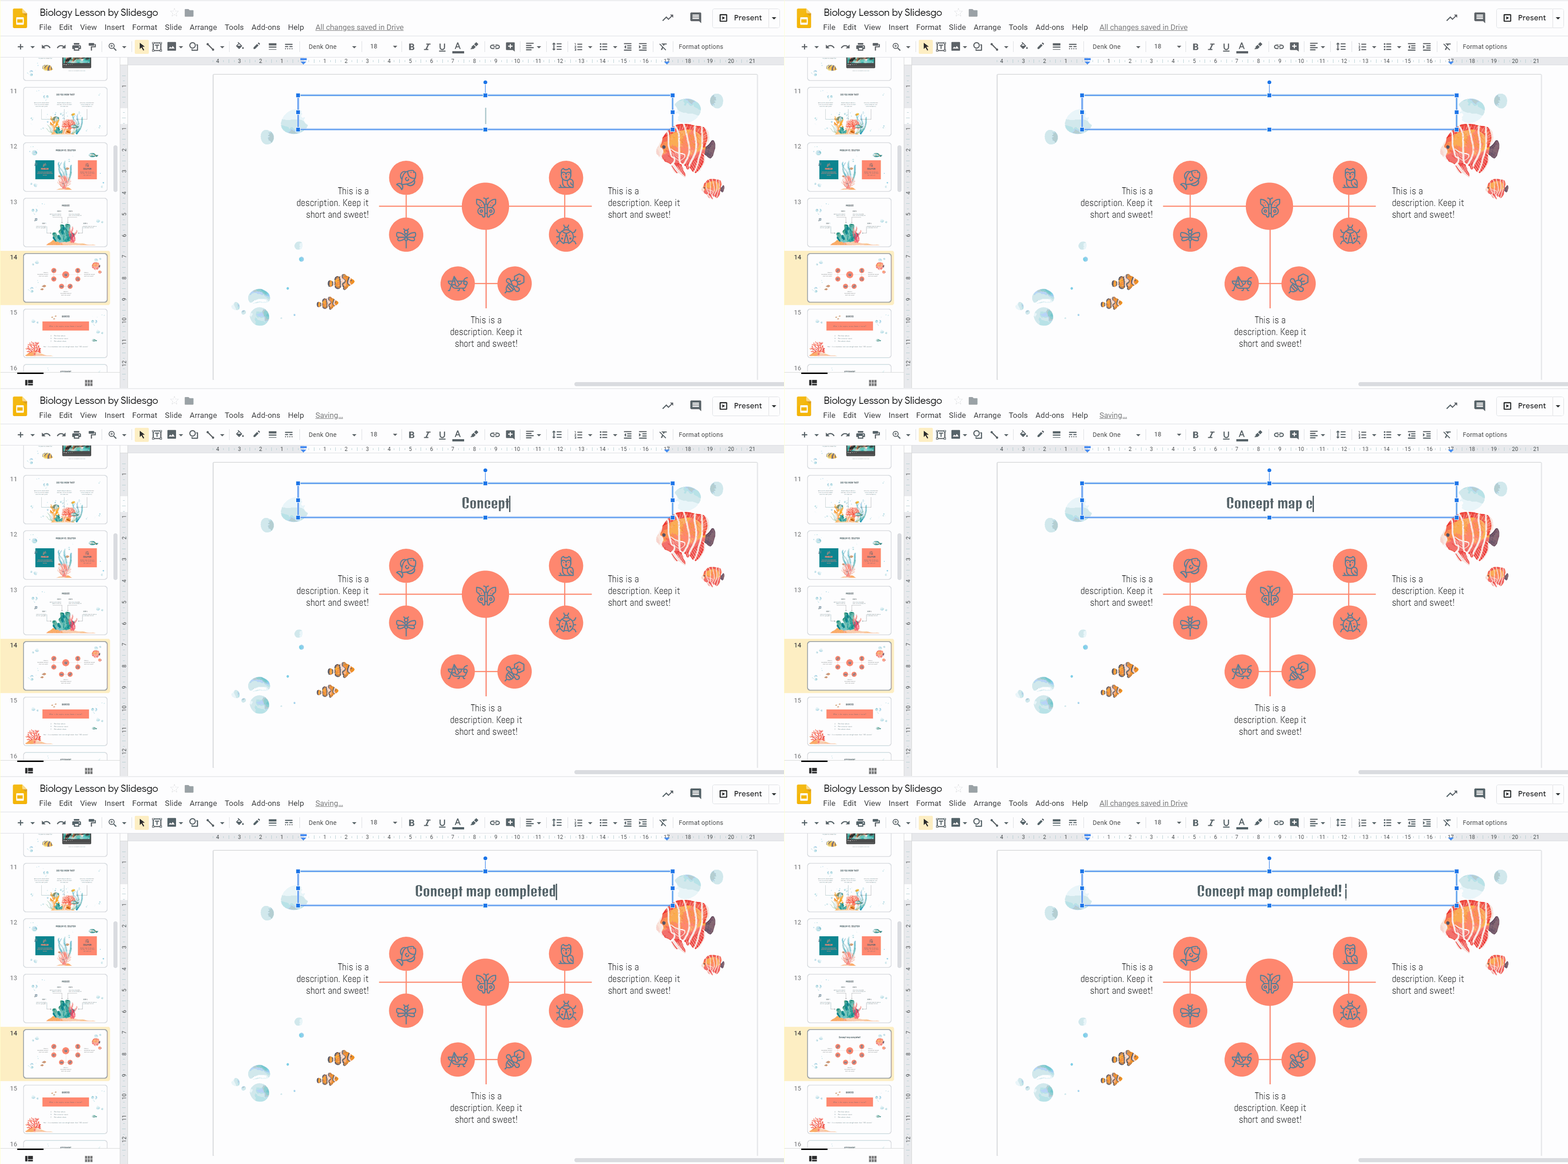
With this, you’re well equipped to make a concept map in Google Slides. If you prefer, you may also try out some of Slidesgo’s beautiful templates that are ready for you to use and adapt. Check our most popular themes now!
Do you find this article useful?
Related tutorials

How to present survey results in PowerPoint or Google Slides
A survey is a technique that is applied by conducting a questionnaire to a significant sample of a group of people. When we carry out the survey, we start from a hypothesis and it is this survey activity that will allow us to confirm the hypothesis or to see where the problem and solution of what we are investigating lies.We know: fieldwork is hard work. Many hours collecting data, analyzing and organizing it until we have our survey results.Well, we don't want to discourage you (at Slidesgo we stand for positivism) but this is only 50% of the survey work....

How to Create a Venn Diagram in Google Slides
If you wish to give an awesome presentation, using diagrams is great because they make your data look nicer and help your audience understand your points.In this Slidesgo School article, we’ll teach you how to create Venn diagrams in Google Slides so you can have them in your bag of resources!

How to Create a Venn Diagram in PowerPoint
How many times did you have to explain your data with a PowerPoint presentation and you weren’t able to find the most visual way to do it? To help you with this matter easily and quickly, in this Slidesgo School post we will explain how to insert or create a Venn diagram in PowerPoint, as well as its history and components.

How to add and edit maps in Google Slides
Map infographics are very useful for any presentation, as they allow you to transmit data quickly and easily. In this post we are going to explain how to include and edit maps in your Google Slides presentations.


