
How to Modify a Graph in Our Templates

One of the advantages of using Slidesgo templates is that they include editable graphs. This makes it easier for you to edit and customize the presentation and you will not waste time thinking about how to represent your data.
If you would like to edit these charts easily and get the most out of them, in this tutorial we will show you how to do it step by step.
Access the spreadsheet of the graph
Before starting, you should know that these graphs are created from data entered in a spreadsheet. In our case, the spreadsheet is created in Google Sheets, which, like Google Slides, is part of the Google suite and therefore allows this interactivity.
First, open one of our templates and locate a slide in which there is a chart. If you click on it, you will get a small pop-up window that tells you which document it is linked to (in the case of our templates, a Google Sheets file).
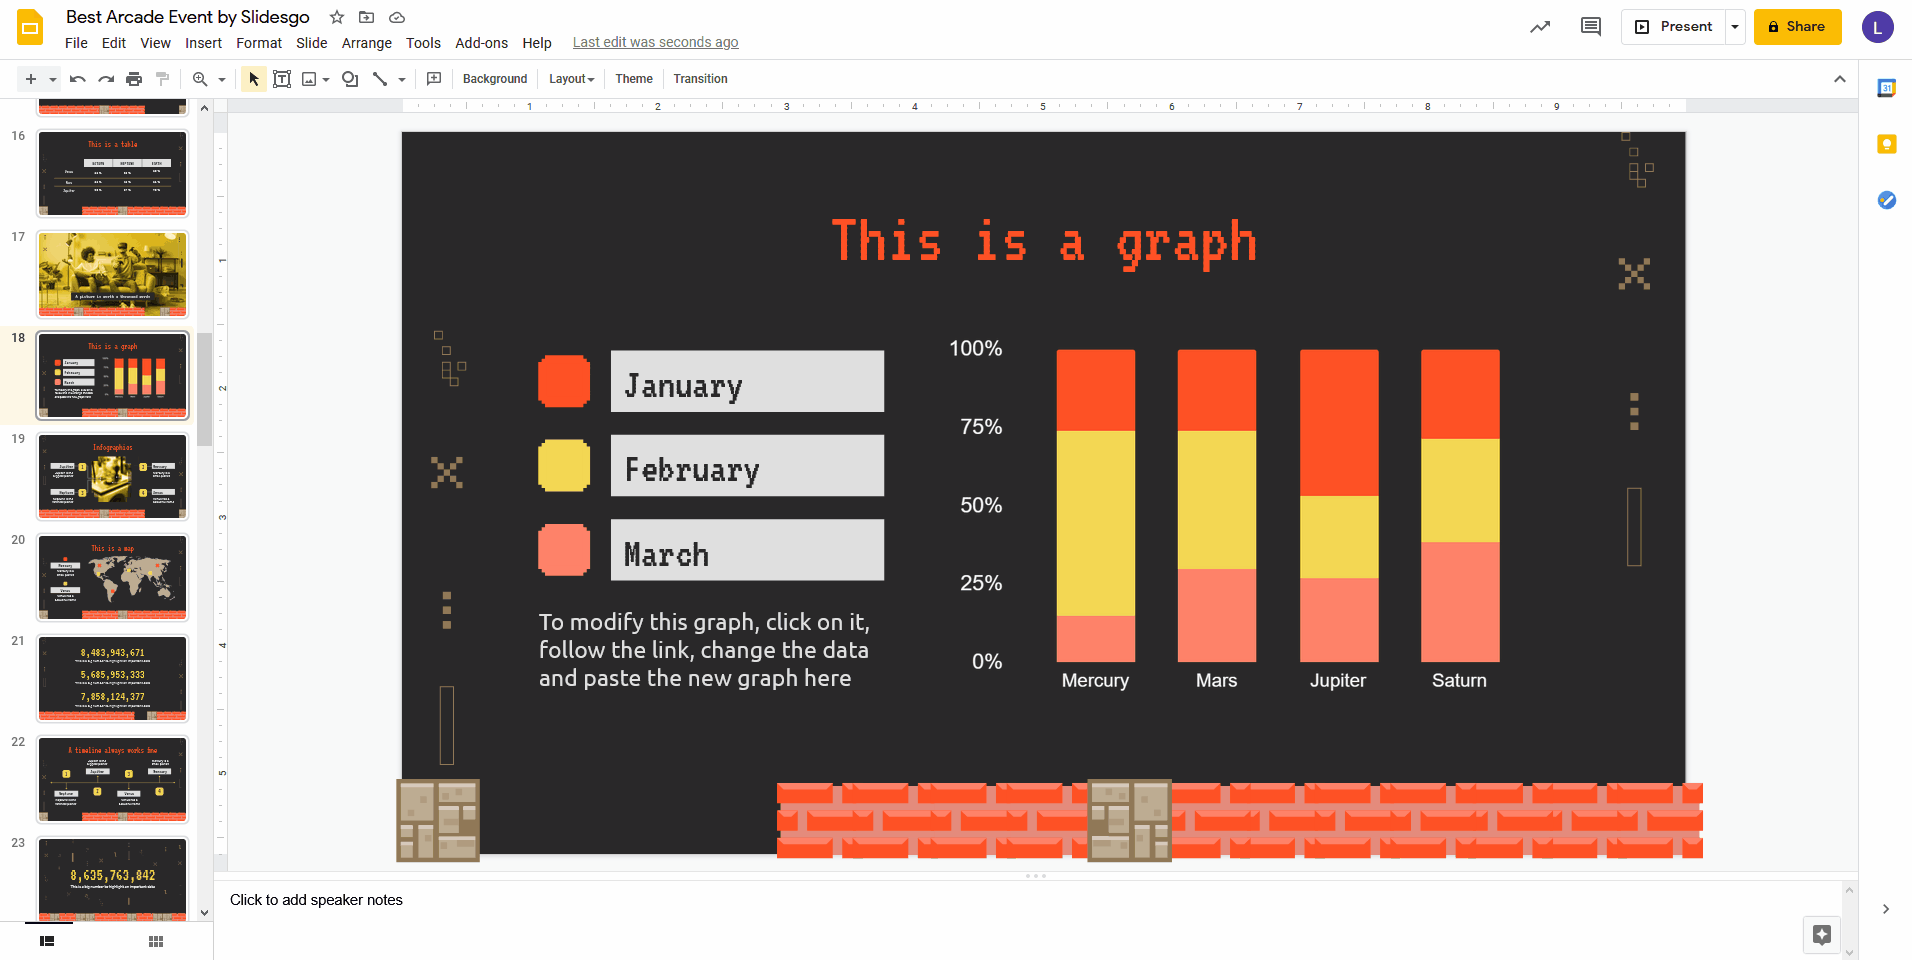
To access this spreadsheet, click on its name in the pop-up window. If you are using PowerPoint, you will need to hold down Ctrl (or Cmd) and click on the chart. You will be asked if you want to make a copy of the file. Click "Make a copy" to generate it.
Note: Keep in mind that, if the graph you see does not correspond to the one on the slide, it may be on the second sheet (or on any of the others, if there are more). Click on the sheets at the bottom until you find the desired graph.
Modify the data of the graph
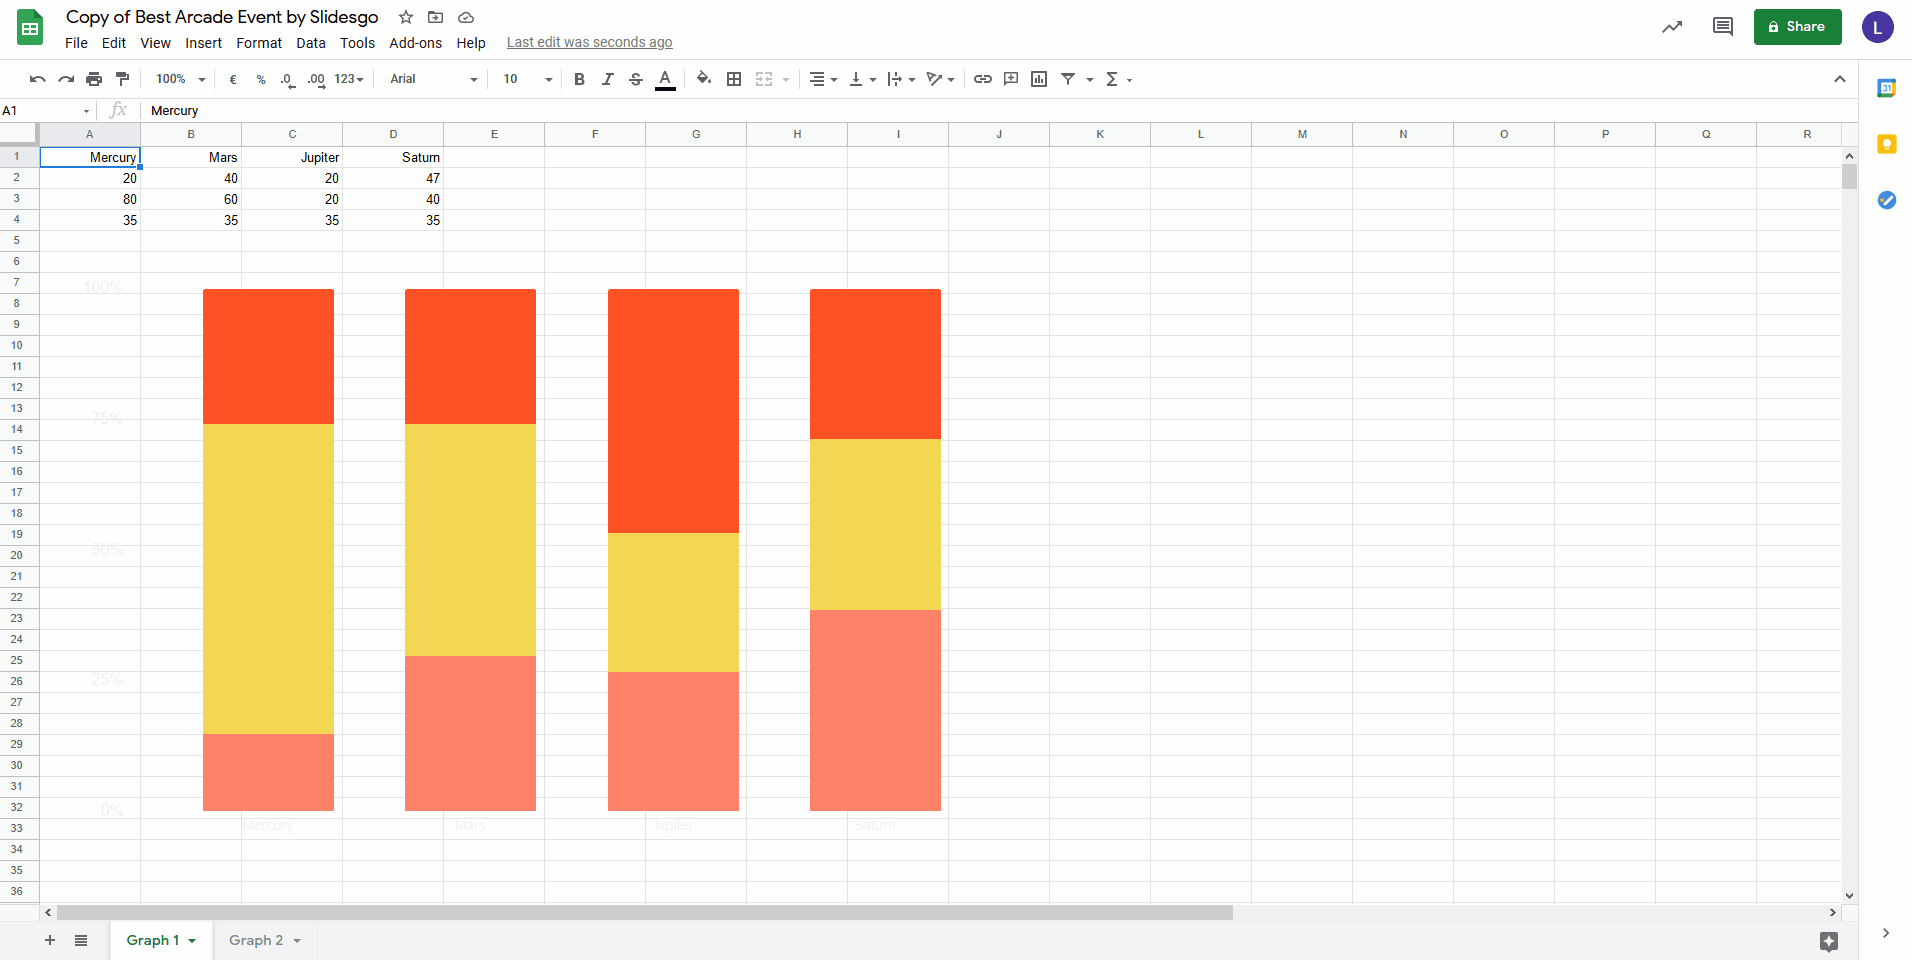
Now that you are in the spreadsheet, you will see some data, which will vary depending on the Slidesgo template you are working with. As a general rule, in most of them you will find some numbers (which are the ones that give shape to the elements of the chart).
Here you can make all kinds of modifications according to your needs. For example, you can change these values to those that fit what you want to represent. The best thing is that, whenever you make any changes, the graph is automatically updated in the spreadsheet.

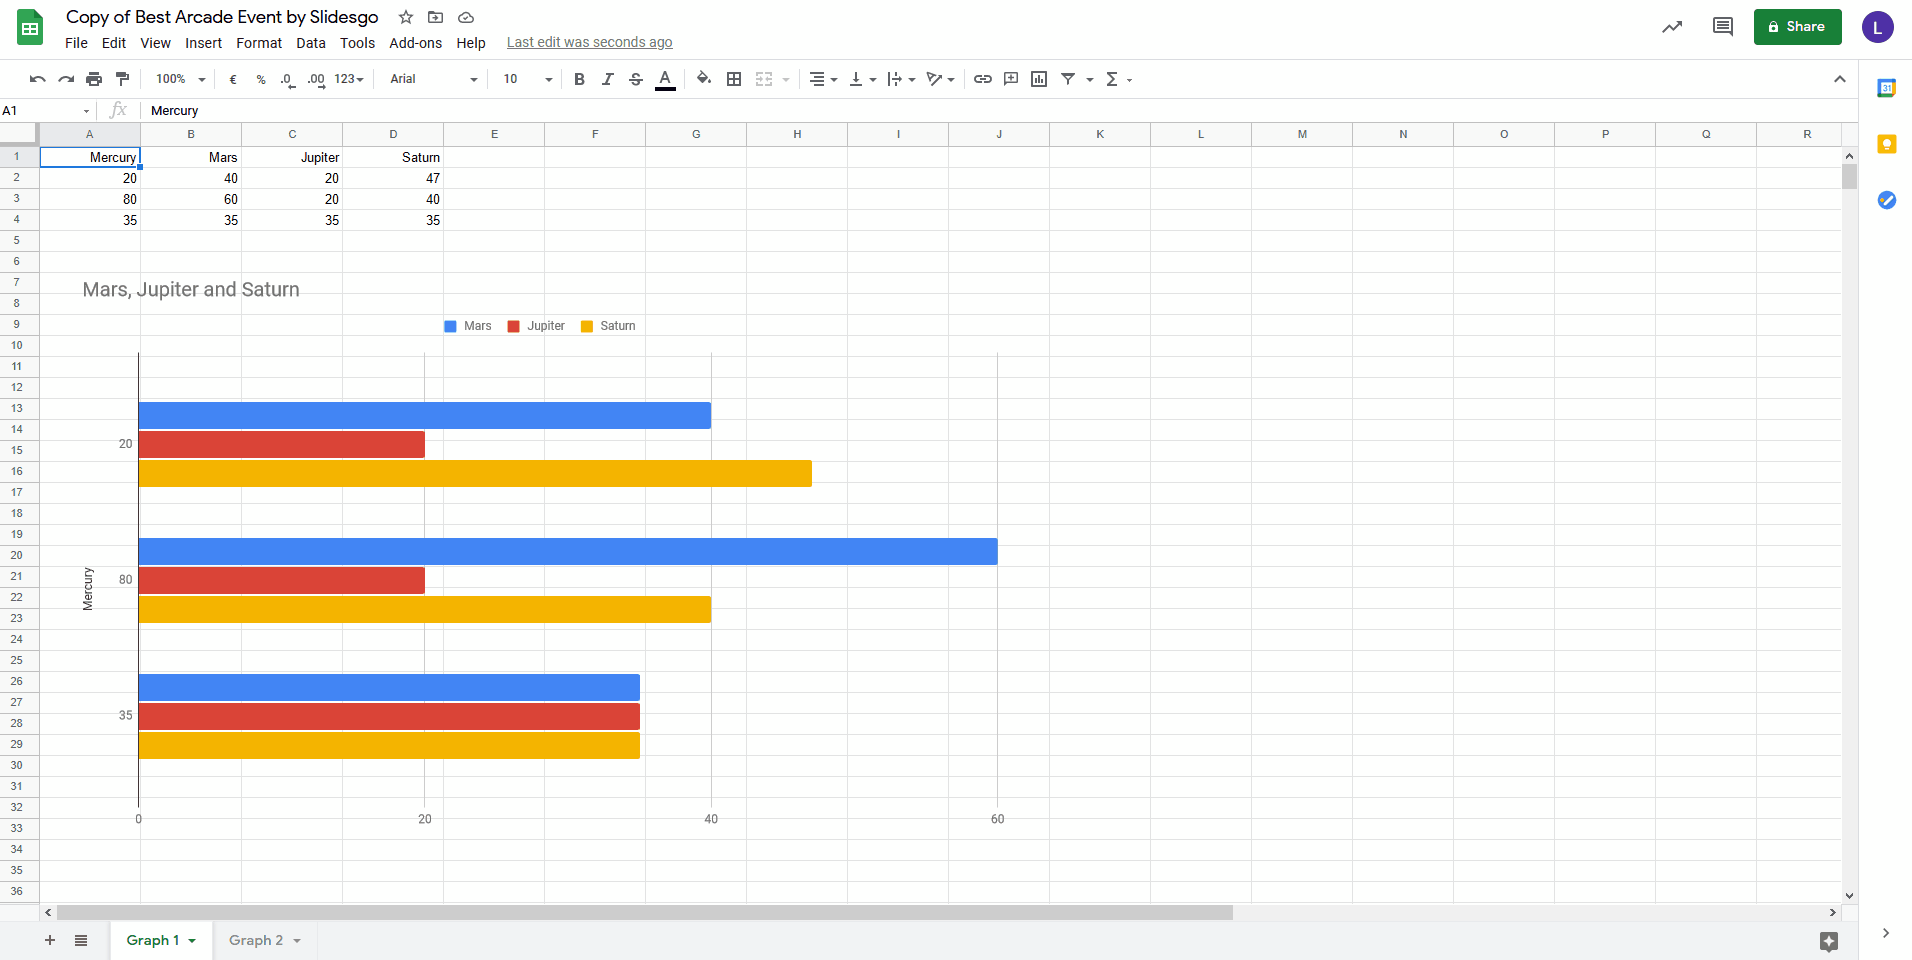
You can also choose another type of chart. To do this, select it, click on the ellipsis and choose "Edit chart". A panel will appear on the right, from which you can make all kinds of adjustments.
For example, in the "Setup" tab, you can click on the "Chart type" drop-down arrow and select the one you prefer.
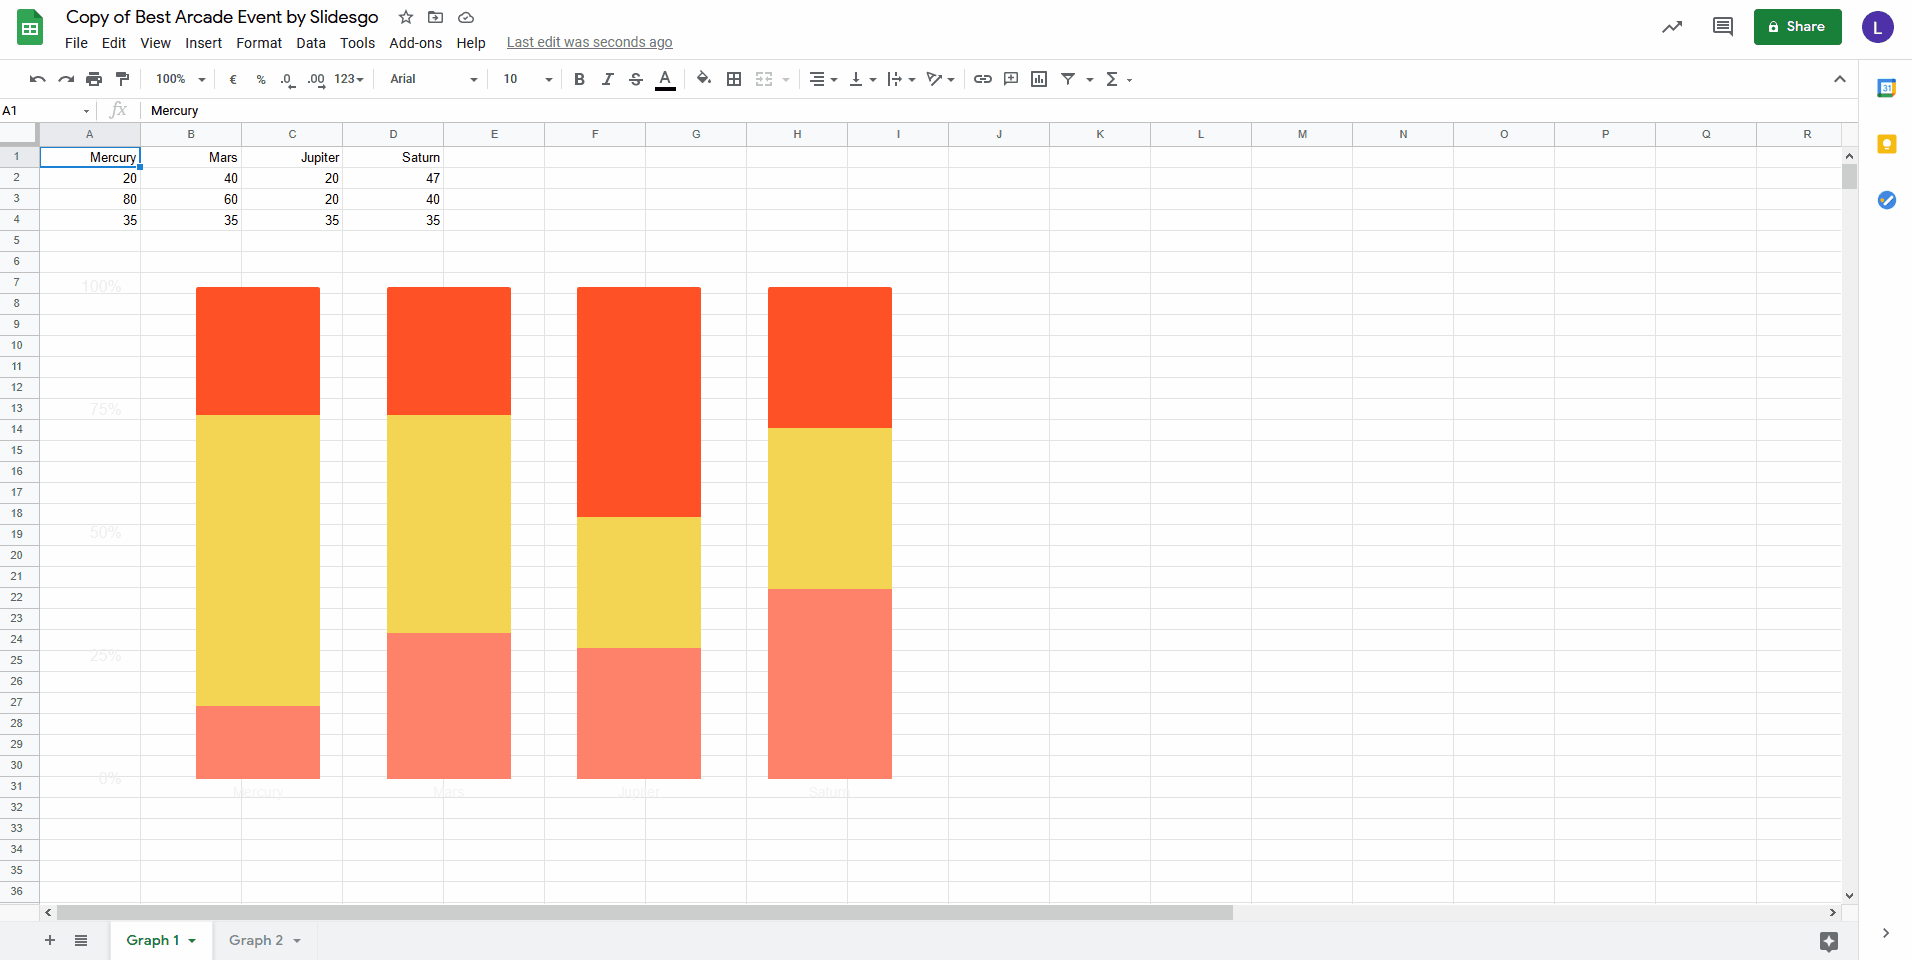
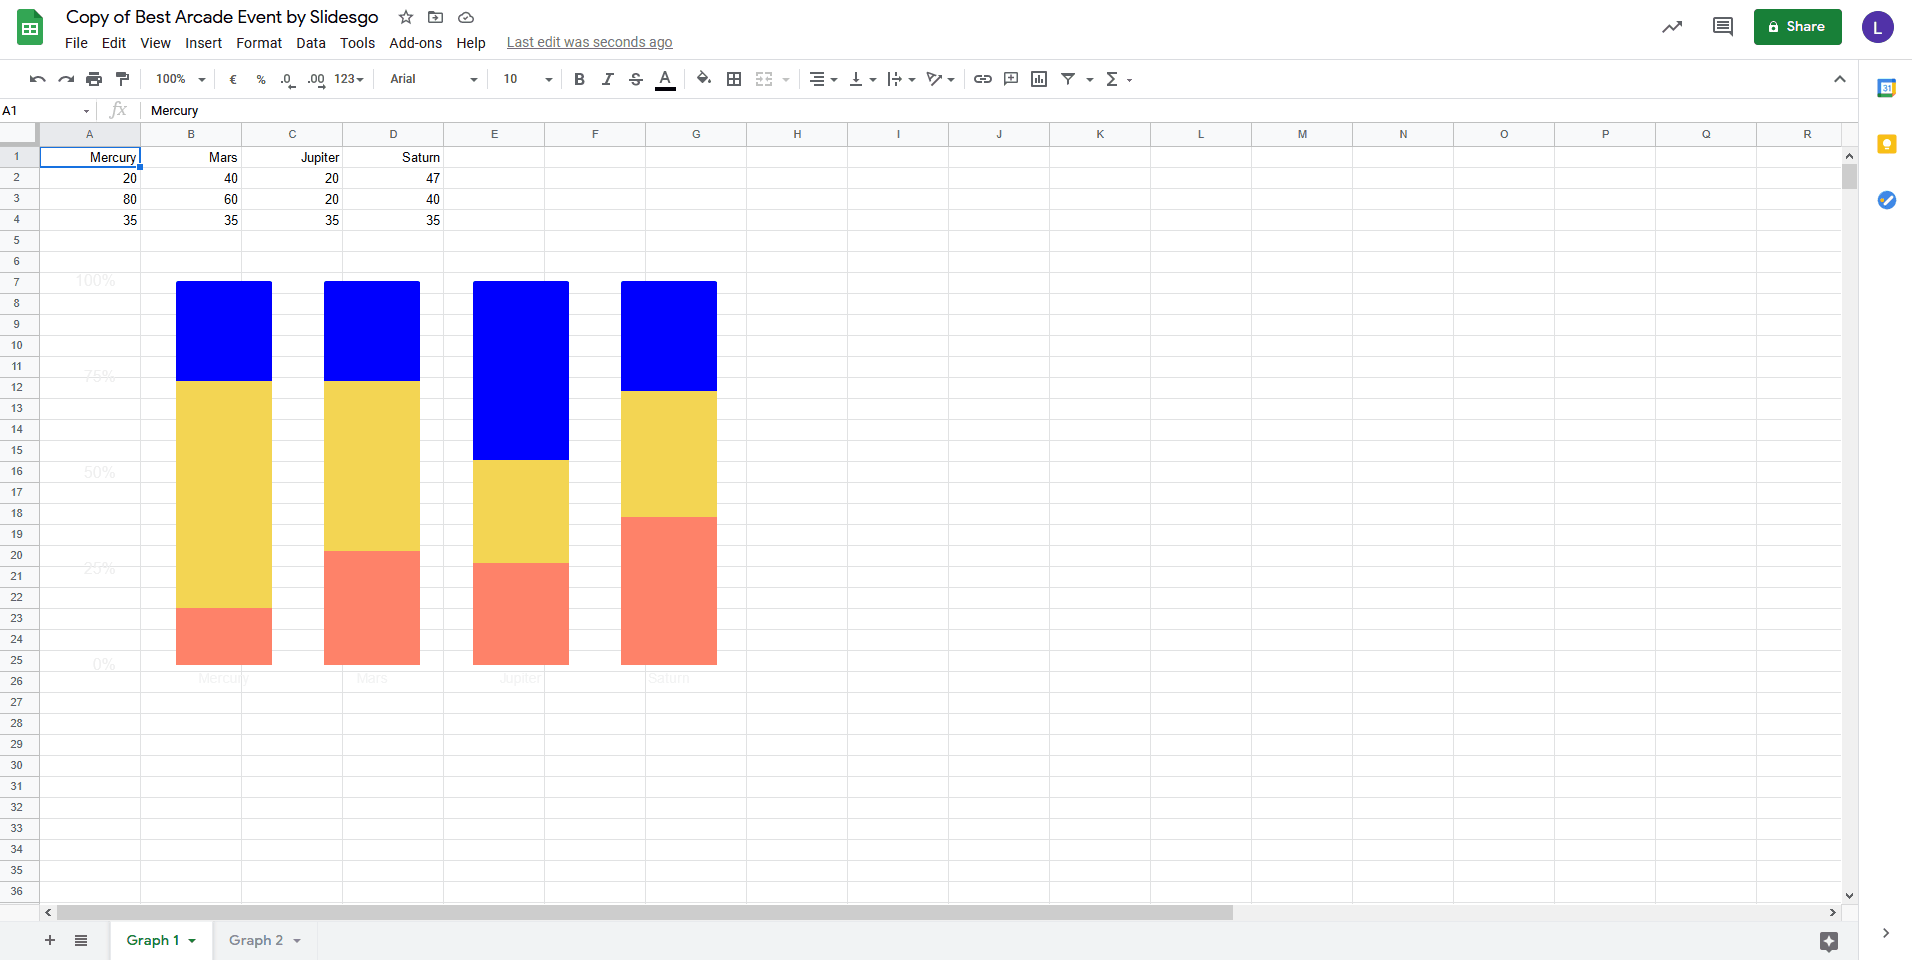
Another thing you can do is to change the colors of the elements. Just click on the "Customize" tab, then drop down the "Series" section, choose which element to change from the selector and, finally, choose the color you like best.
You can also resize the chart to make it larger or smaller. This will help you to better fit the space you have on the slide. Simply select the chart and drag one of the handles in the selection box.
This is just a small sample of what can be done with a chart. Go ahead and experiment on your own!
Paste the new chart on the slide
Once you have finished making all the necessary modifications, all that remains is to paste the chart on the slide again.
The procedure is very simple. First, delete the chart that is already present. Then, select the new chart in the spreadsheet, copy it by pressing Ctrl + C (or Cmd + C), return to the slide and paste it by pressing Ctrl + V (or Cmd + V).
You will be offered two options. "Link to spreadsheet" means that it will be linked to the spreadsheet, so any subsequent modifications you make to that file can be transferred directly to the presentation by clicking the "Update" button that will appear in the upper right corner of the chart.

The second option, "Paste unlinked", allows you to simply insert the chart, without the possibility of automatically updating it. The disadvantage is that any modification you want to make afterwards will require you to copy and paste the resulting chart into the slide once again. However, the advantage is that you avoid possible accidental changes.
Note: If you are using PowerPoint, these linking options will not appear, as this software is not owned by Google.
If, on the other hand, you want to learn how to create a chart from scratch, we have this tutorial for PowerPoint and this one to create a chart in Google Slides.
All set? Give it a try in one of our Google Slides and PowerPoint presentations. Check out our collection and get the inspiration you need!
Tags
Edit & FormatDo you find this article useful?
Related tutorials
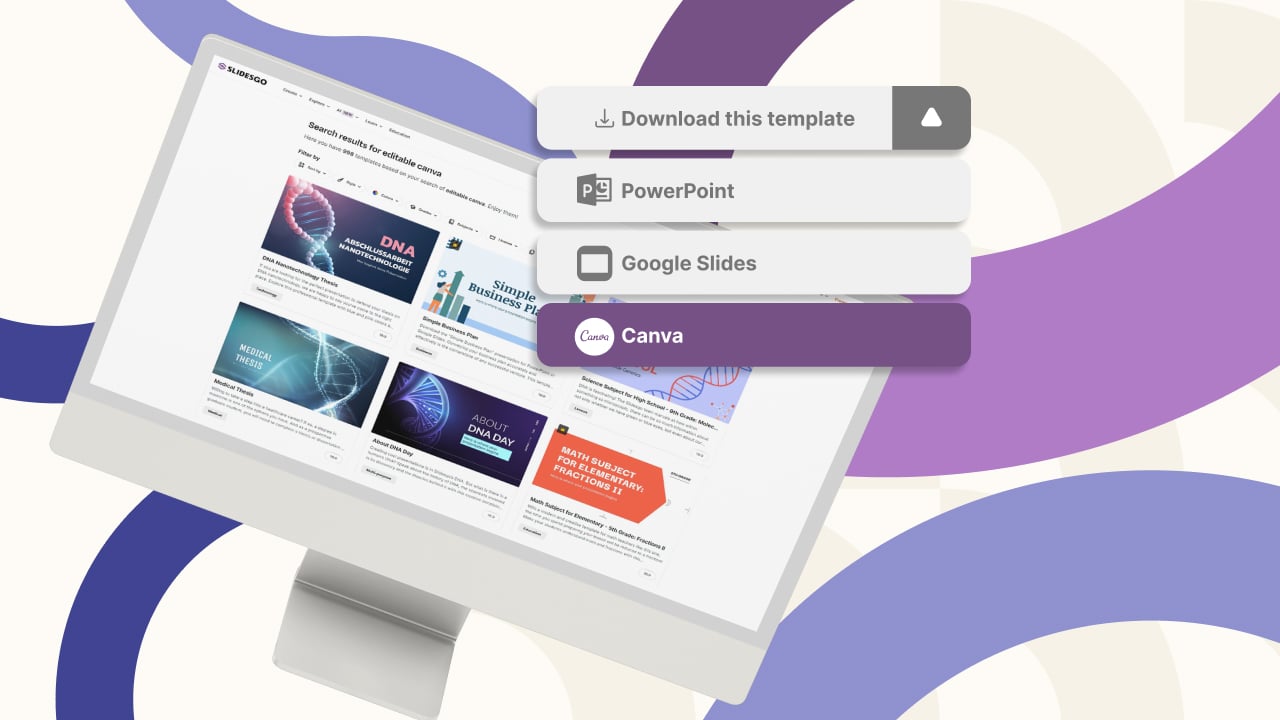
New feature available: edit our templates with Canva
Whenever you need to create, Slidesgo is there. We’re continually enhancing your presentation design process with templates that are primed to impress for any occasion. And in order to let your ideas flow best, comfort is key. How could Slidesgo help you with this? By making you feel right at home with our resources, no matter your preferred platform.You spoke, and we listened. Now, your favorite slides can be accessed on a new platform: Canva! This new format adds to our existing options (PowerPoint and Google Slides), expanding your ways to utilize our first-rate presentation content. We’ve started with a selection of Canva-ready...
How to print PowerPoint notes
Crafting an impactful PowerPoint slideshow and delivering a captivating presentation are distinct skills. The first focuses on designing appealing visuals to convey a clear message, while the second involves employing effective presentation techniques to ensure the audience grasps the idea. The content of this article will help you with the latter part of this process, guiding future presenters on how to print PowerPoint with speaker notes to enhance your presentations success and effectiveness.

Discover Our Online Presentation Software for Free
We have great news for you today! If you’ve been a Slidesgo fan for years (or months, or weeks, or days, or mere hours, we welcome everyone!), you’ll probably know for now that our templates are available mostly in two formats: for use in Google Slides and PowerPoint.Google Slides is a free tool, since you only need a Google account in order to use it. PowerPoint, on the other hand, is part of the Microsoft Office suite, so it’s not a free program, but that didn’t stop it from being one of the most popular options in the world!What if we...

Webinar: Presentation Audit
With more than 15,000 templates released on Slidesgo and a user base composed of millions of people, we estimate that the total number of presentations created adds up to… um, a lot! Our team of professional designers work very hard to provide you with editable slides so that the only thing you need to do is, well, customize the elements to your liking. Starting from any given template, the results may vary a lot depending on the person who edited the contents.Have you ever wondered “Is my presentation good enough?” and wished that an expert on presentations looked at your template...