How to Create a Timeline in Google Slides

What better way to portray progress and evolution on a Google Slides presentation than with a timeline? A timeline does the job of telling a story (or history) chronologically in a direct and straightforward manner that’s also visually attractive and easy to digest.
It shouldn’t contain too much text so as to not overwhelm the reader yet have just enough to convey a milestone. In this Slidesgo School tutorial, we provide you with step-by-step instructions on creating a timeline in Google Slides.
Creating the outline
- Open your Google Slides presentation.
- Go to the slide you want to insert the timeline to.
- Go to the toolbar and click Select Line → Line.
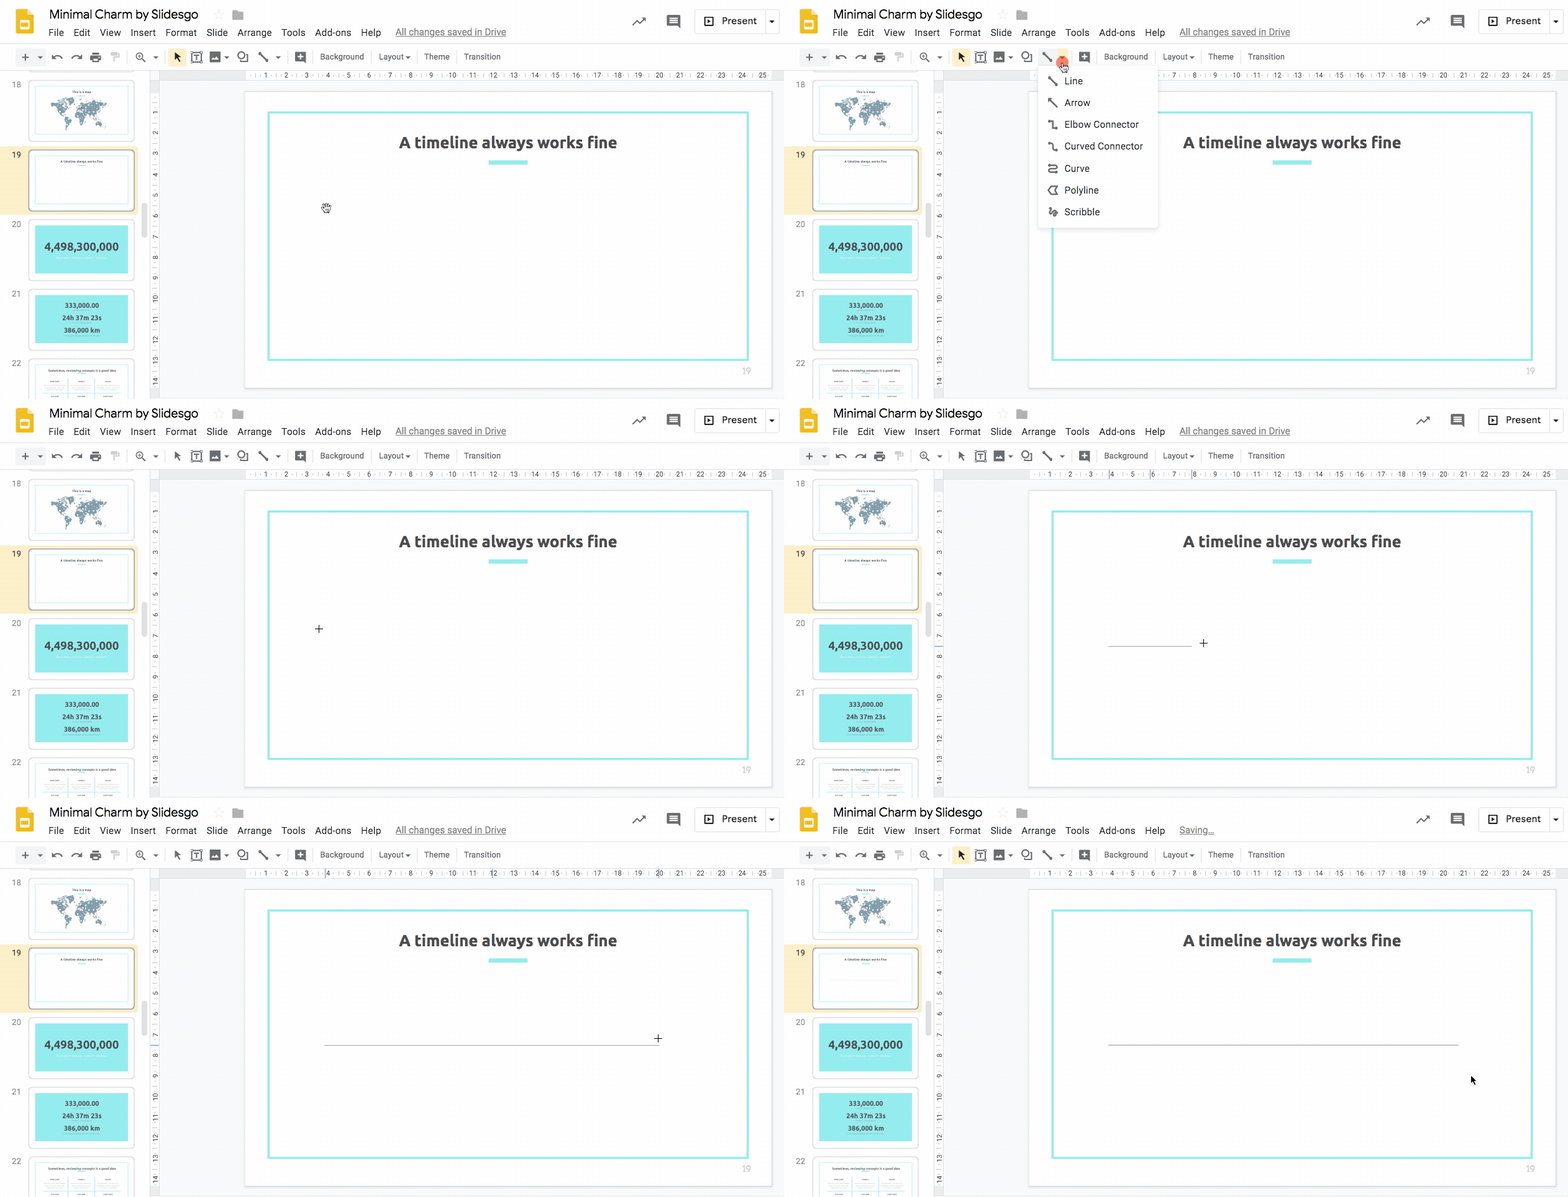
- From the toolbar, select Line color to change color and Line weight to edit thickness. This is to change the style of your line. We recommend you to stick to the same color palette and style used in the rest of the slides.
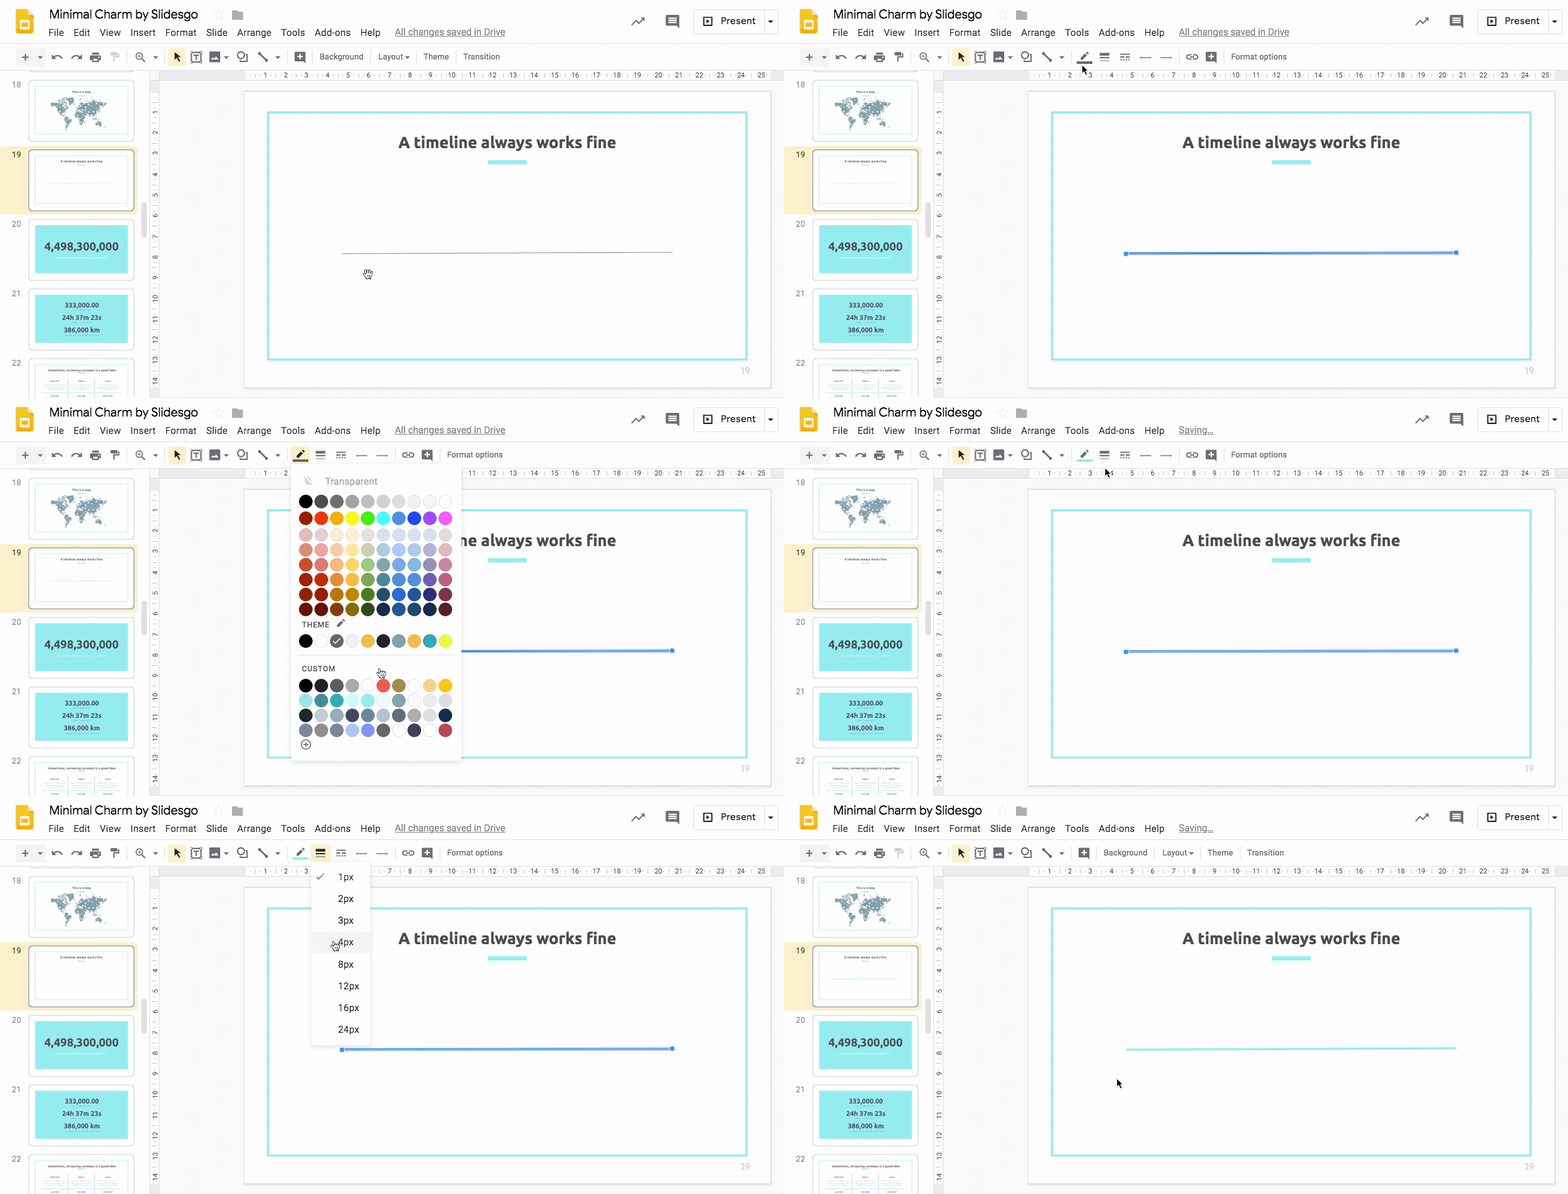
- Select Shape → Shapes from the toolbar. These are all the shapes that are available on Google Slides. Select Oval to create a circle. Each circle represents a milestone. In this timeline, we’ll use five circles for a five-day visualization.
Pro tip: To create a perfect circle, hold on to Shift before you start dragging or while dragging to resize.
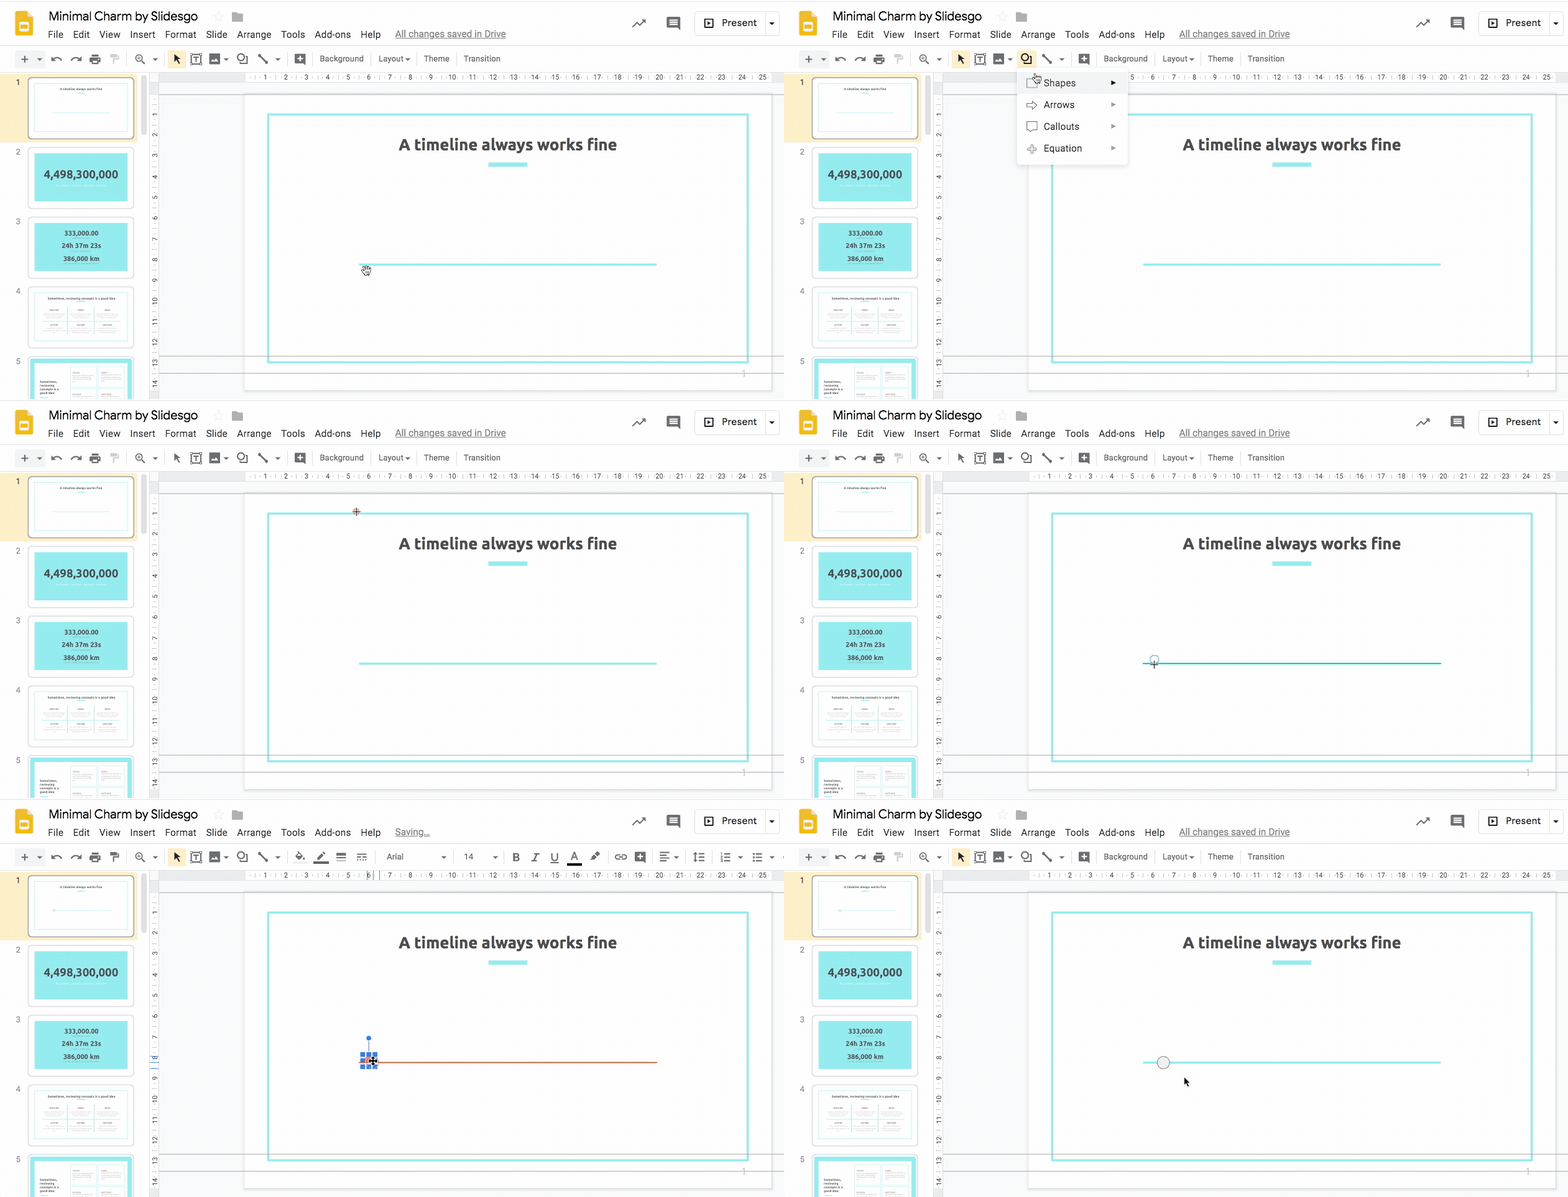
- Change the color of the circle with Fill color in the toolbar. Next to are three additional options to style the border of the circle: Border color, Border weight, and Border dash. Ensure the style of your circle is in line with that of the master slides.
- Color your circle with the same tone as the line and make its border invisible by selecting the Transparent option under Fill color. This gives your Google Slides timeline a smoother look.
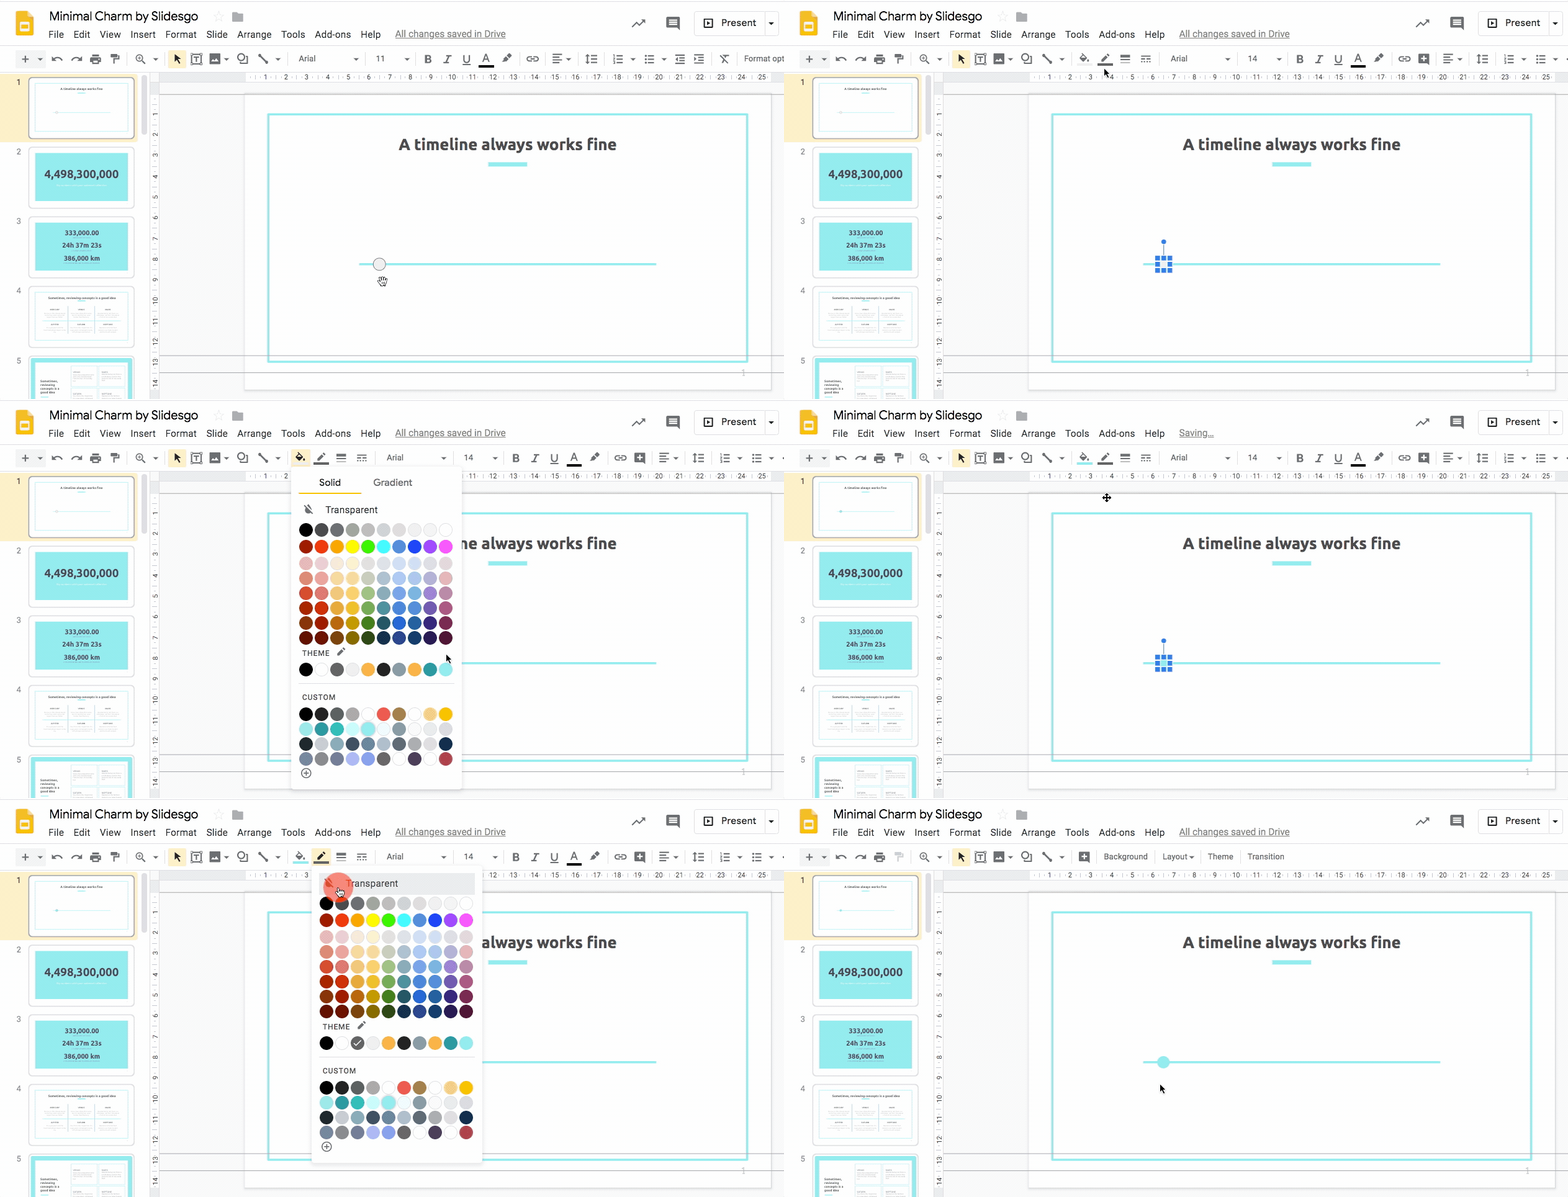
- Copy and paste the circle four times to produce a timeline with five milestones.
- Select the circle and hold down Ctrl + C to copy and Ctrl + V to paste or Cmd + C and Cmd + V if you are using Mac.
- Move the second circle to where you want the second milestone to be placed.
- Repeat to create the third, fourth, and fifth circles.
Pro tip: When placing subsequent circles, Google Slides displays a visual guide in the form of a line to guide your alignment. Use this guide for a more polished result.
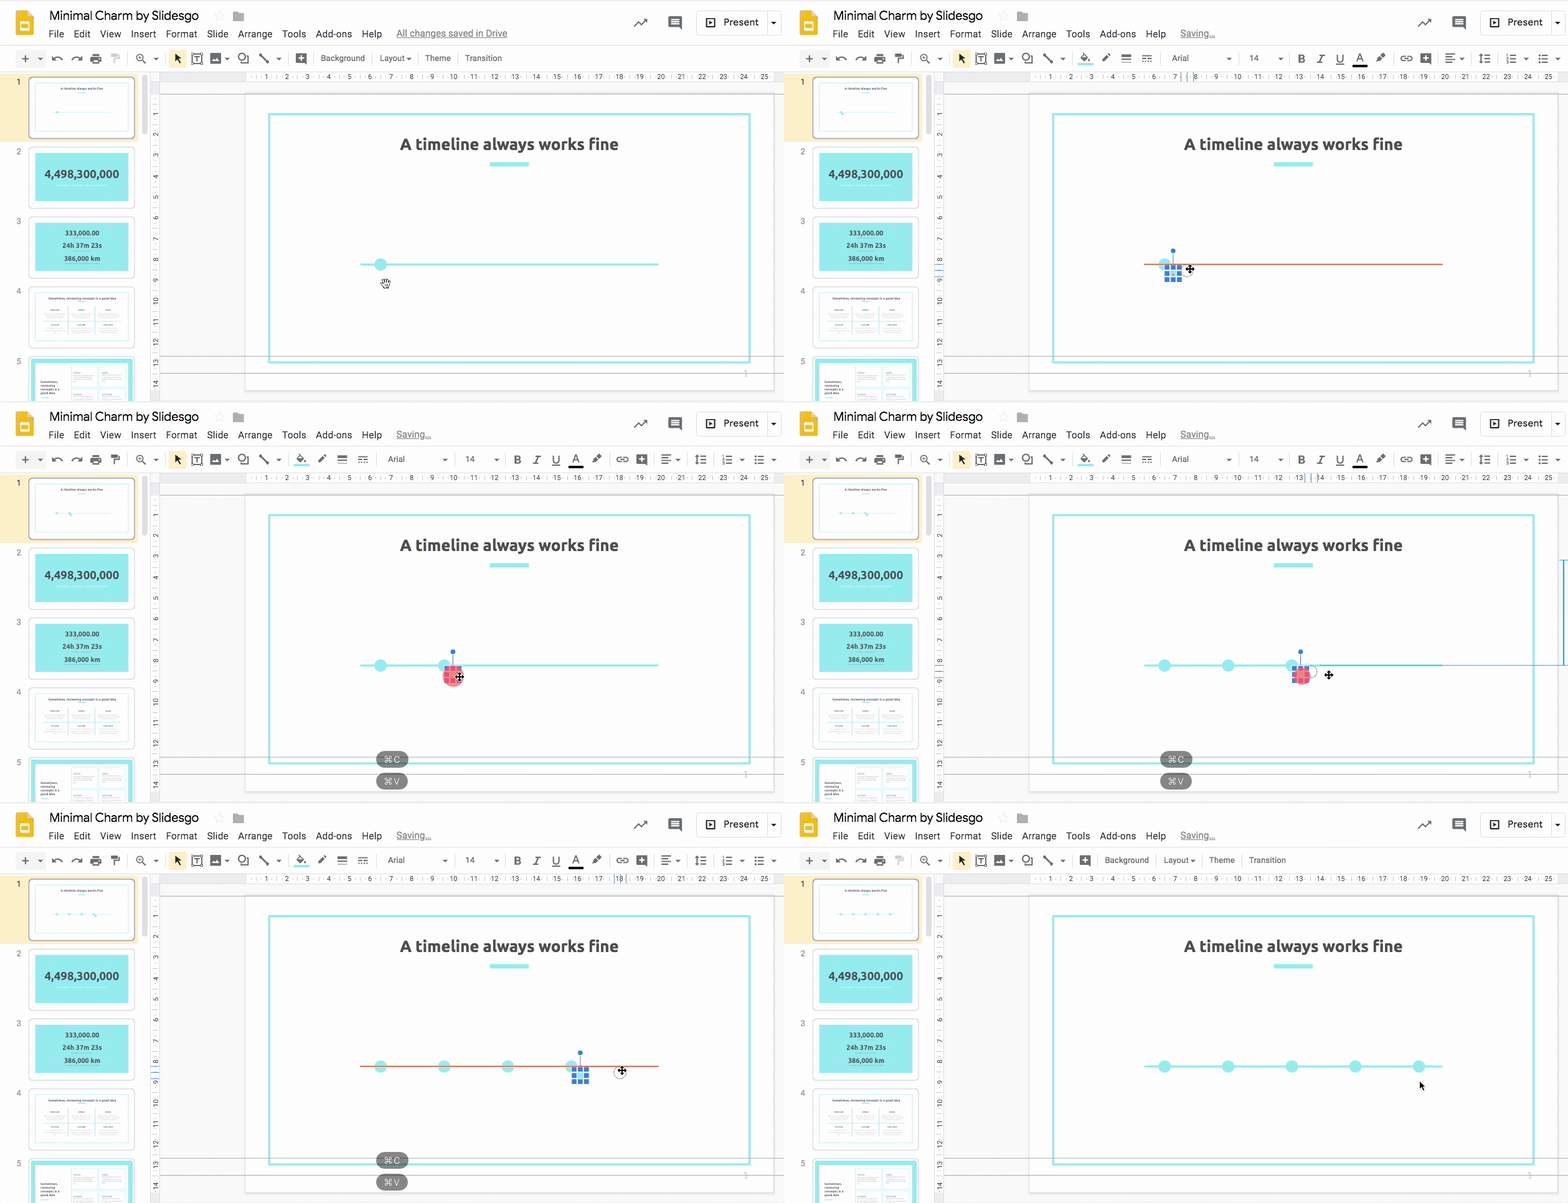
Creating callouts for your text
- Go the toolbar and select Shape → Shapes→ Callouts. This adds a shaped text box to each milestone. You’ve now completed the outline of your timeline.
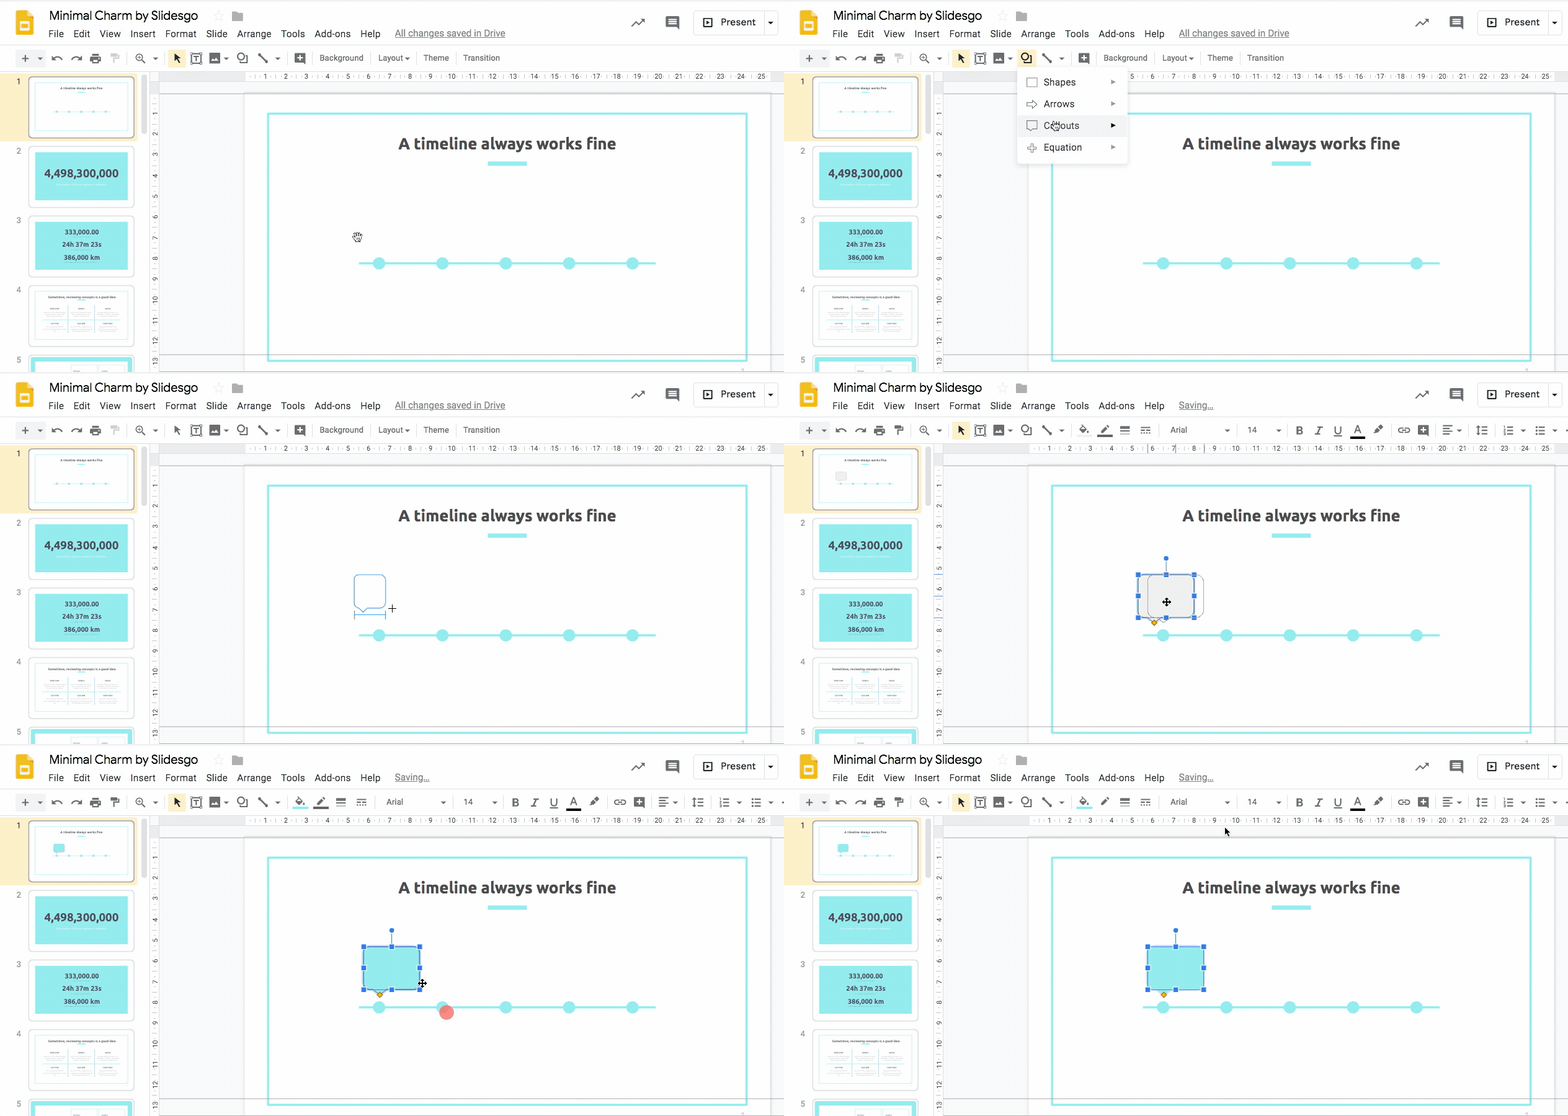
- Google Slides’ default callouts have their tails oriented to one side. To create a personalized callout, add a square and an inverted triangle. Apply the same color and border line style to both shapes.
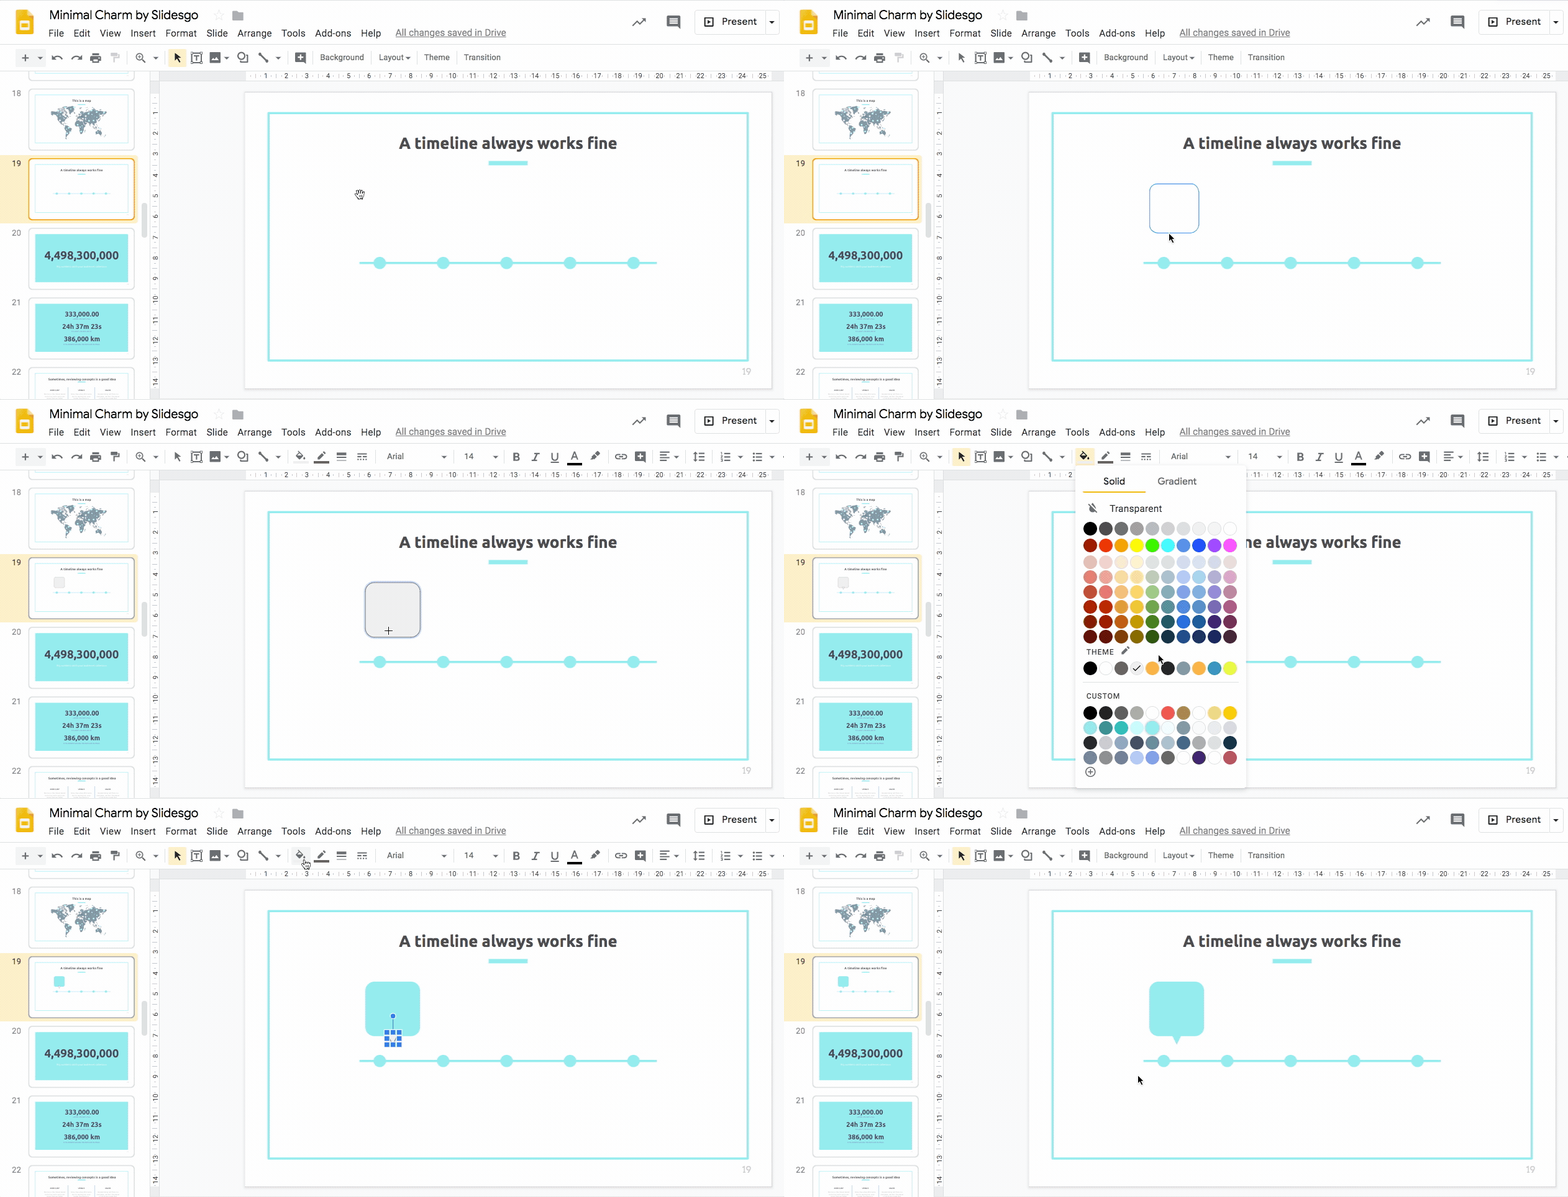
- If you’ve created a personalized callout with a square and an inverted triangle, select the entire area of the callout so that both entities are selected.
Pro tip: Move two (or more) elements together as if they were one by grouping them together. To do so, select on the objects you want to group and click on Arrange → Group.
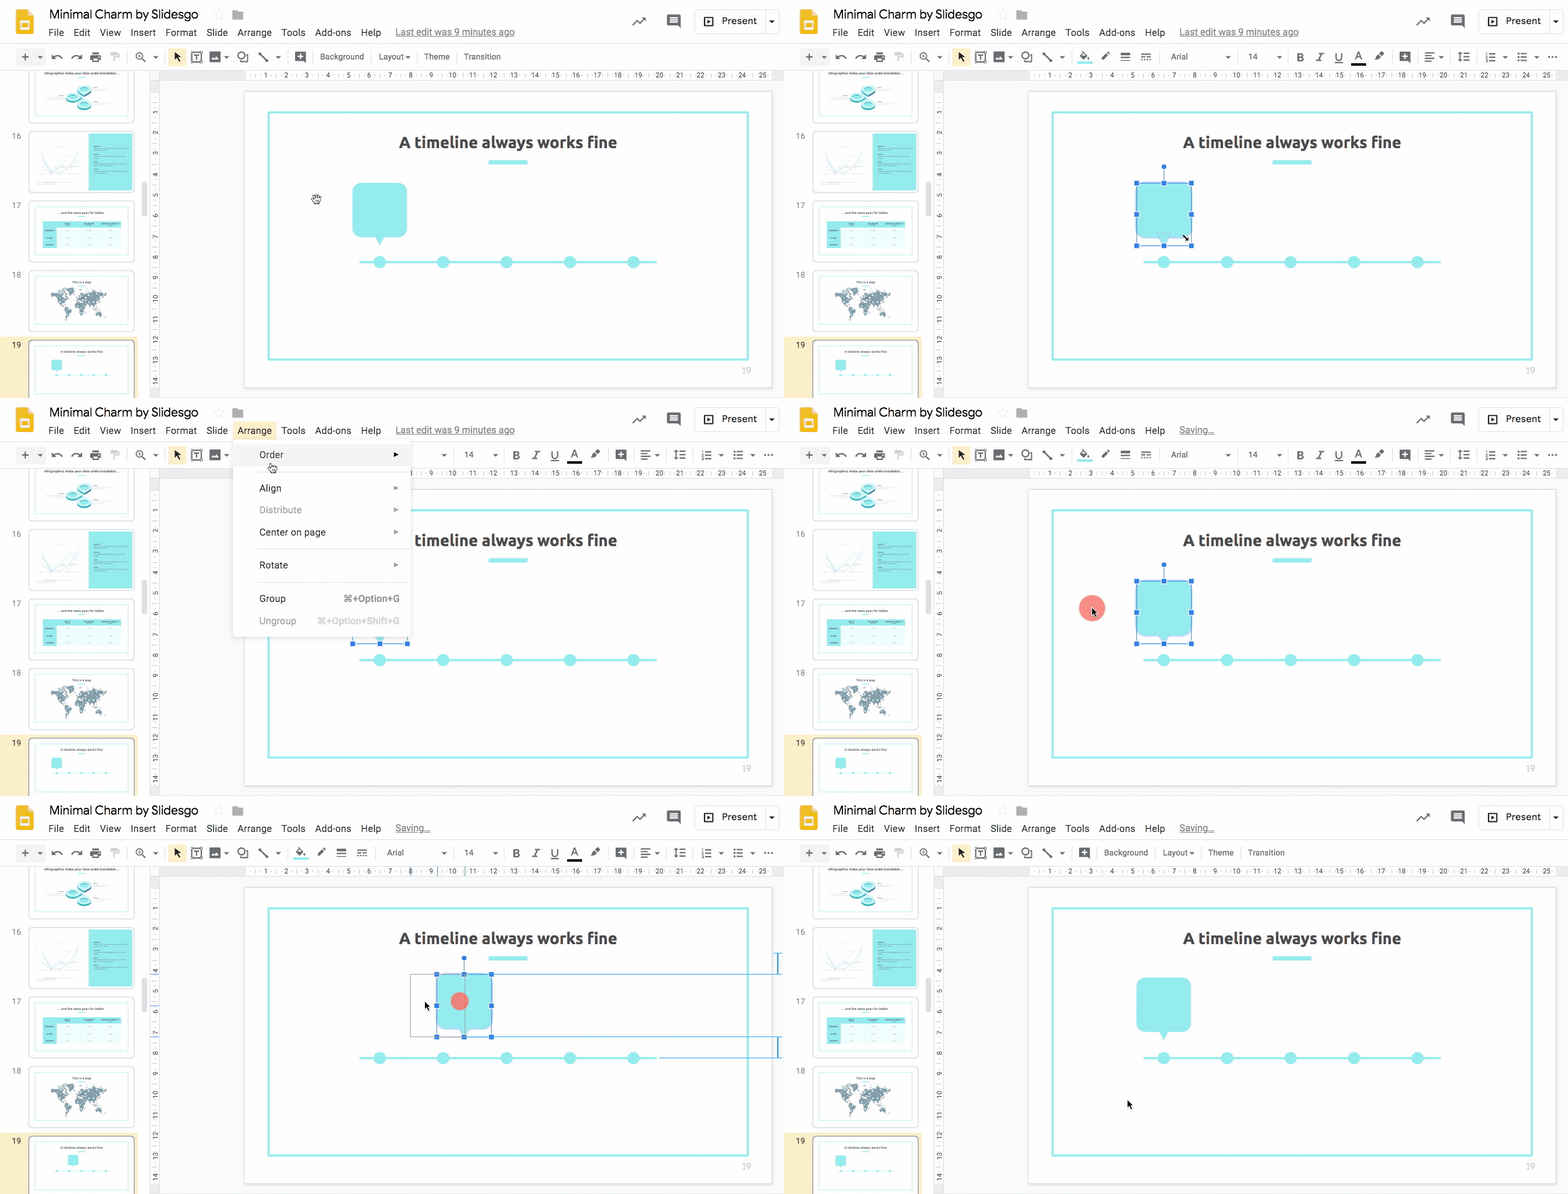
- Copy and paste the callout using Ctrl + C and Ctrl + V or Cmd + C and Cmd + V in Mac.
- Click and drag the callout to place it above another circle.
- Repeat this step as many times as needed to complete the timeline. Make sure the design of your callout is consistent with the template’s design.
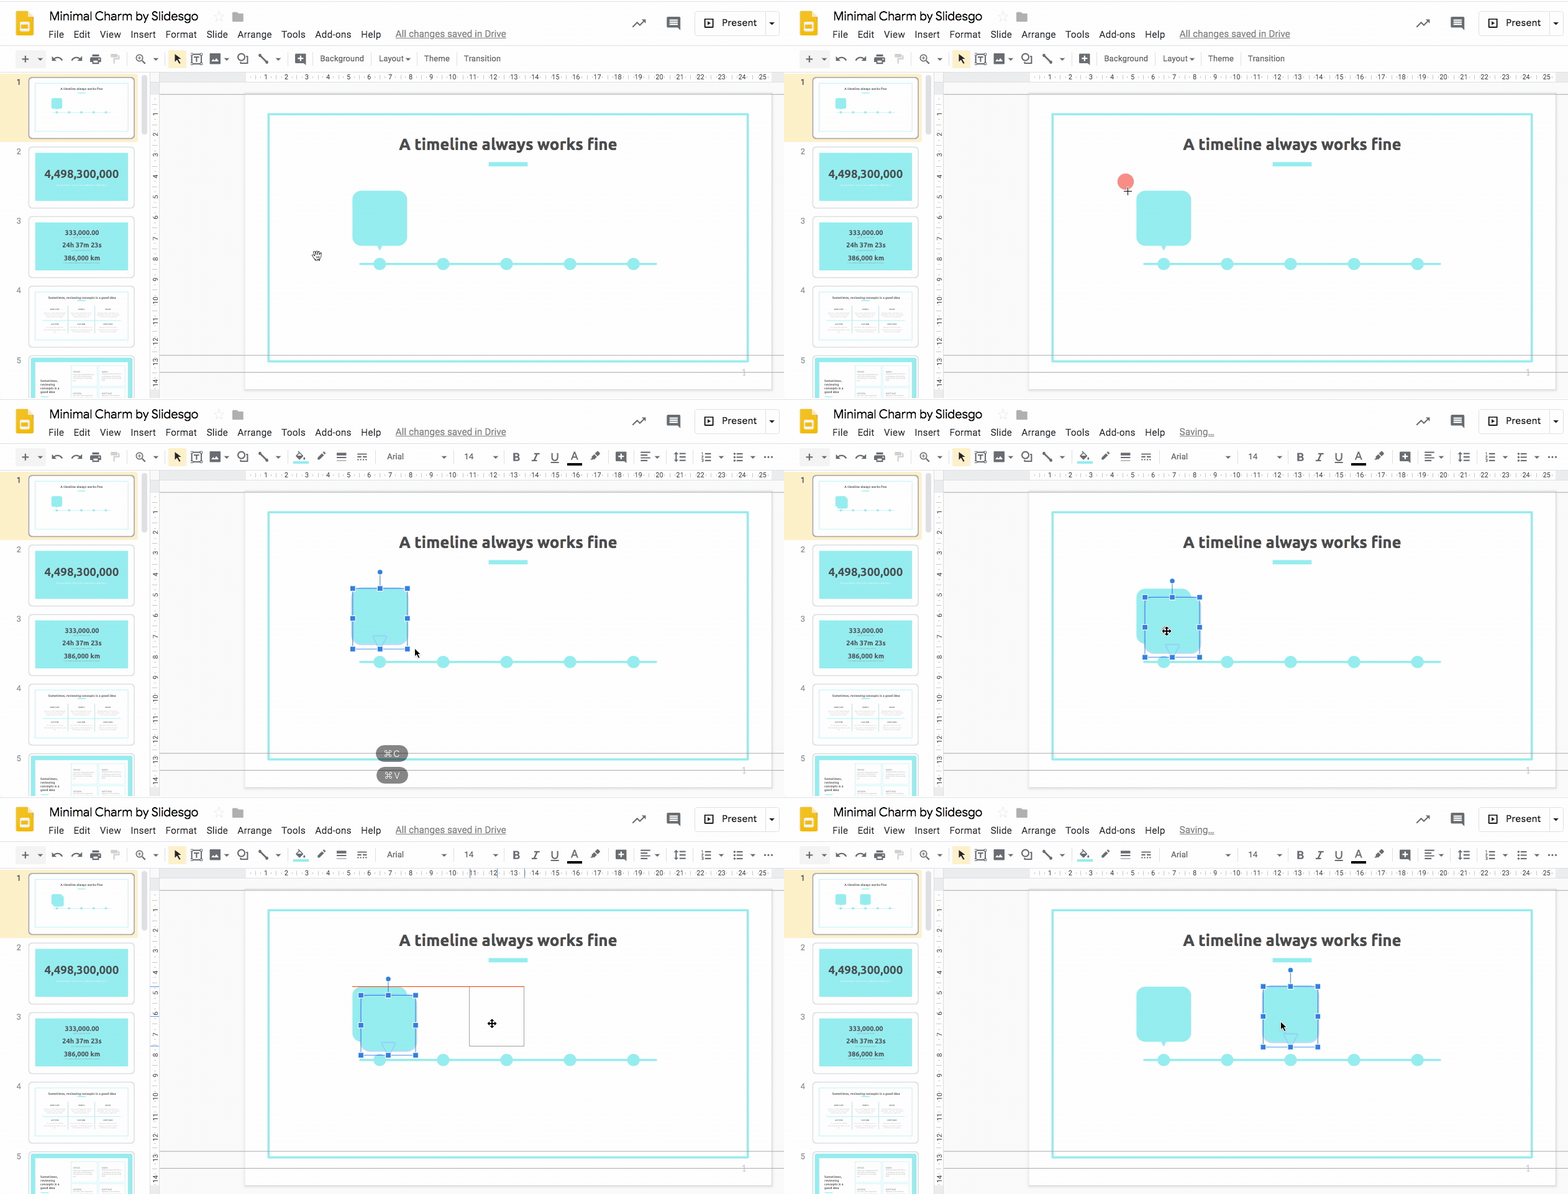
- Alternate the callout’s positioning in relation to the line. This creates extra space on the slide and produces a more dynamic effect.
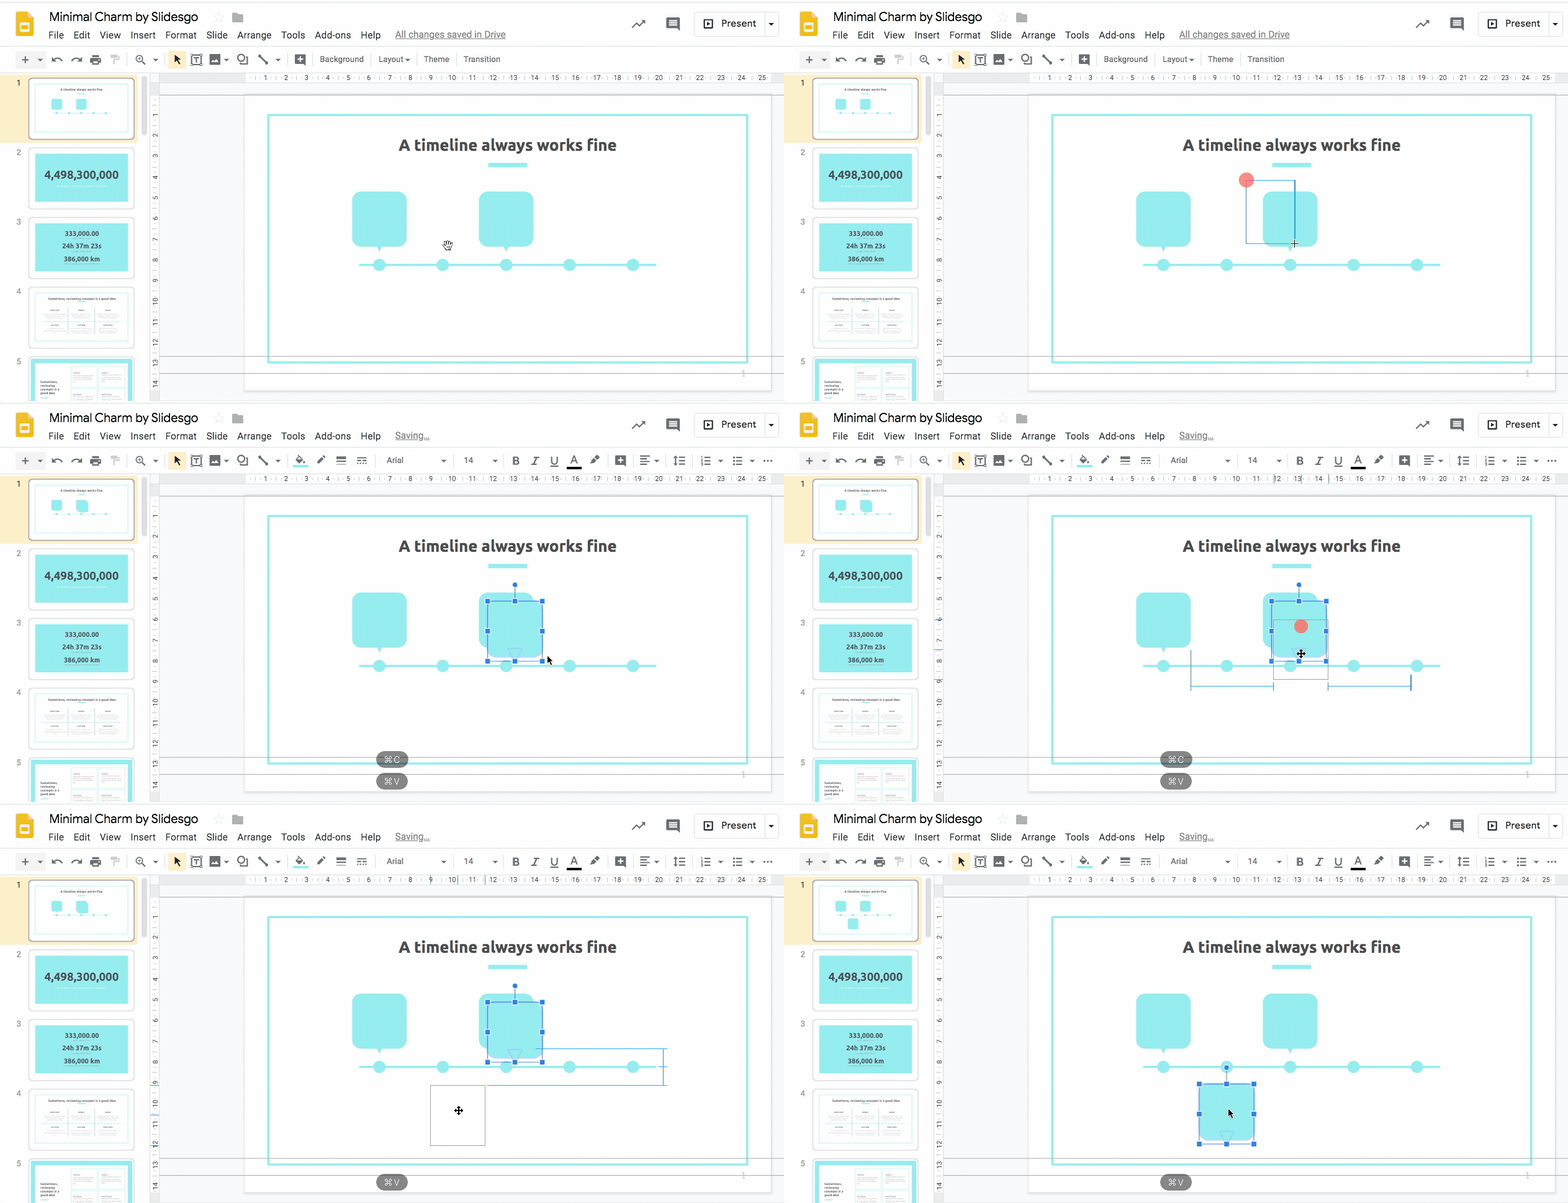
- Select the callout and click on Arrange on the menu bar → Rotate → Flip vertically. This is so the callout points towards the circle (milestone).
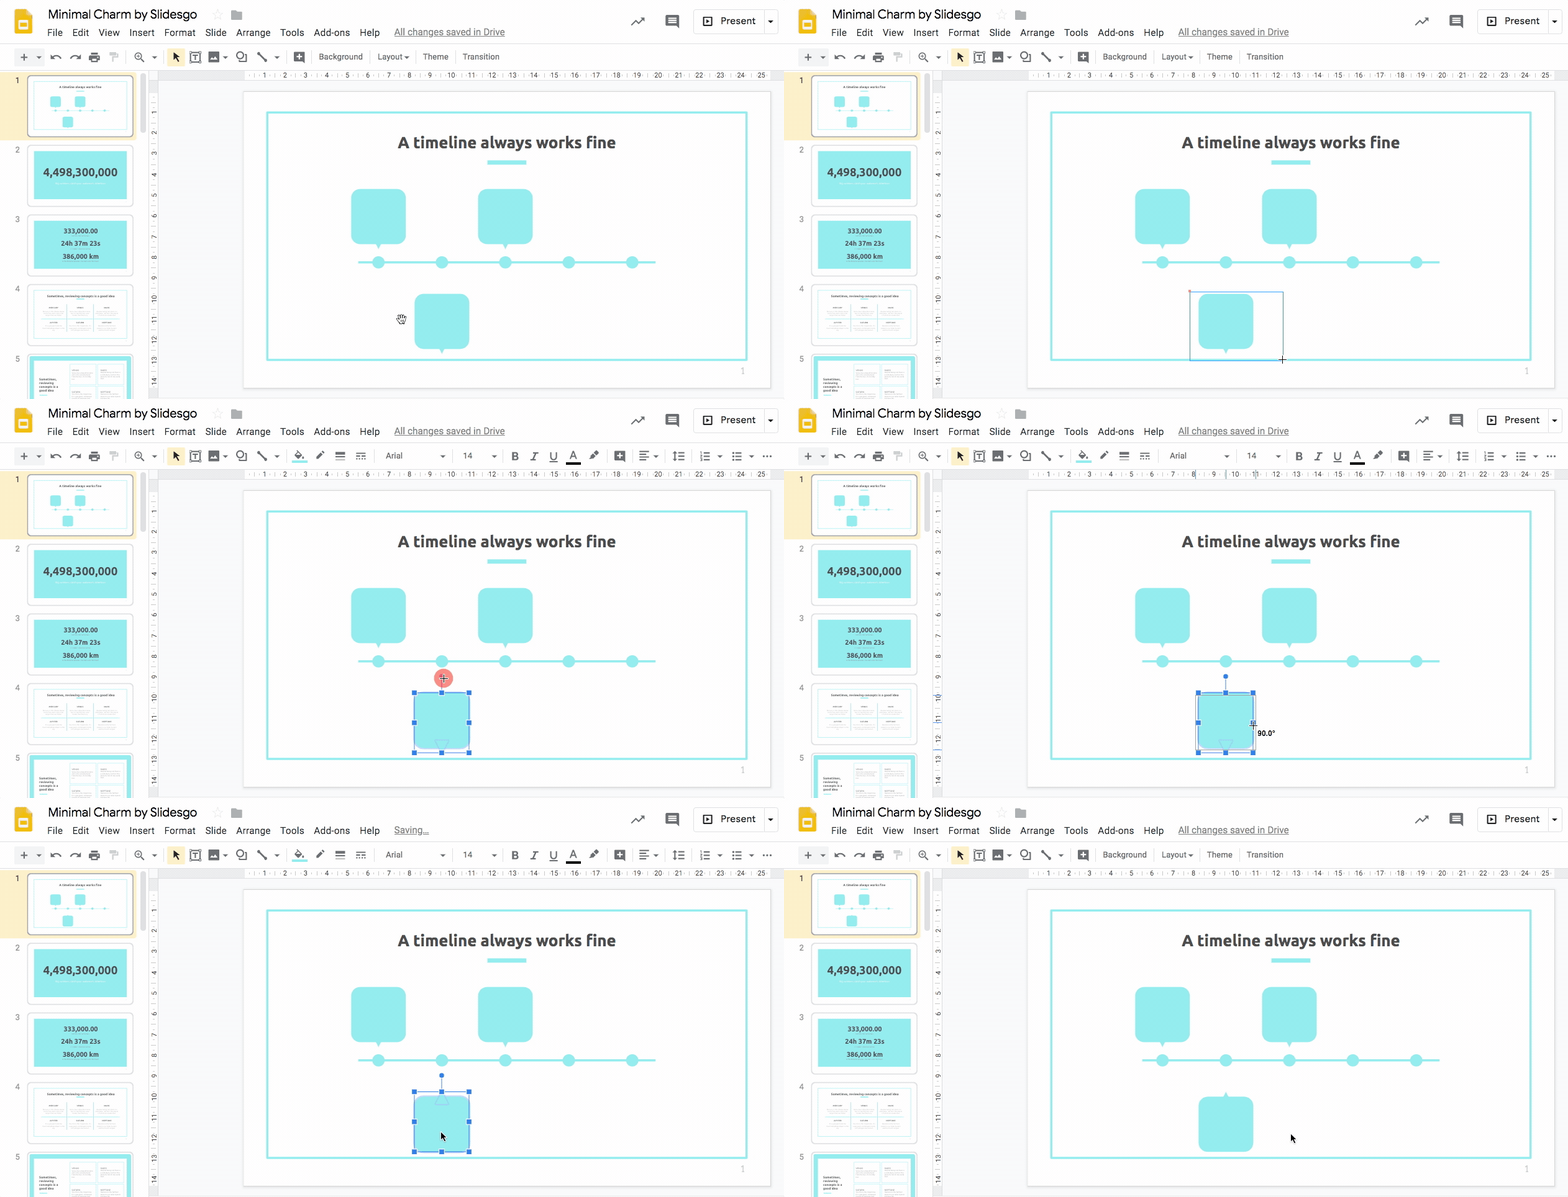
- As a shortcut to flipping or rotating an object, select the callout to bring up the blue dots around it. If it is made up of various elements, select them all. Click on the dot that’s farthest away (and connected by a line) and drag it around to rotate the callout. Hold down Shift to rotate the object in 15-degree increments.
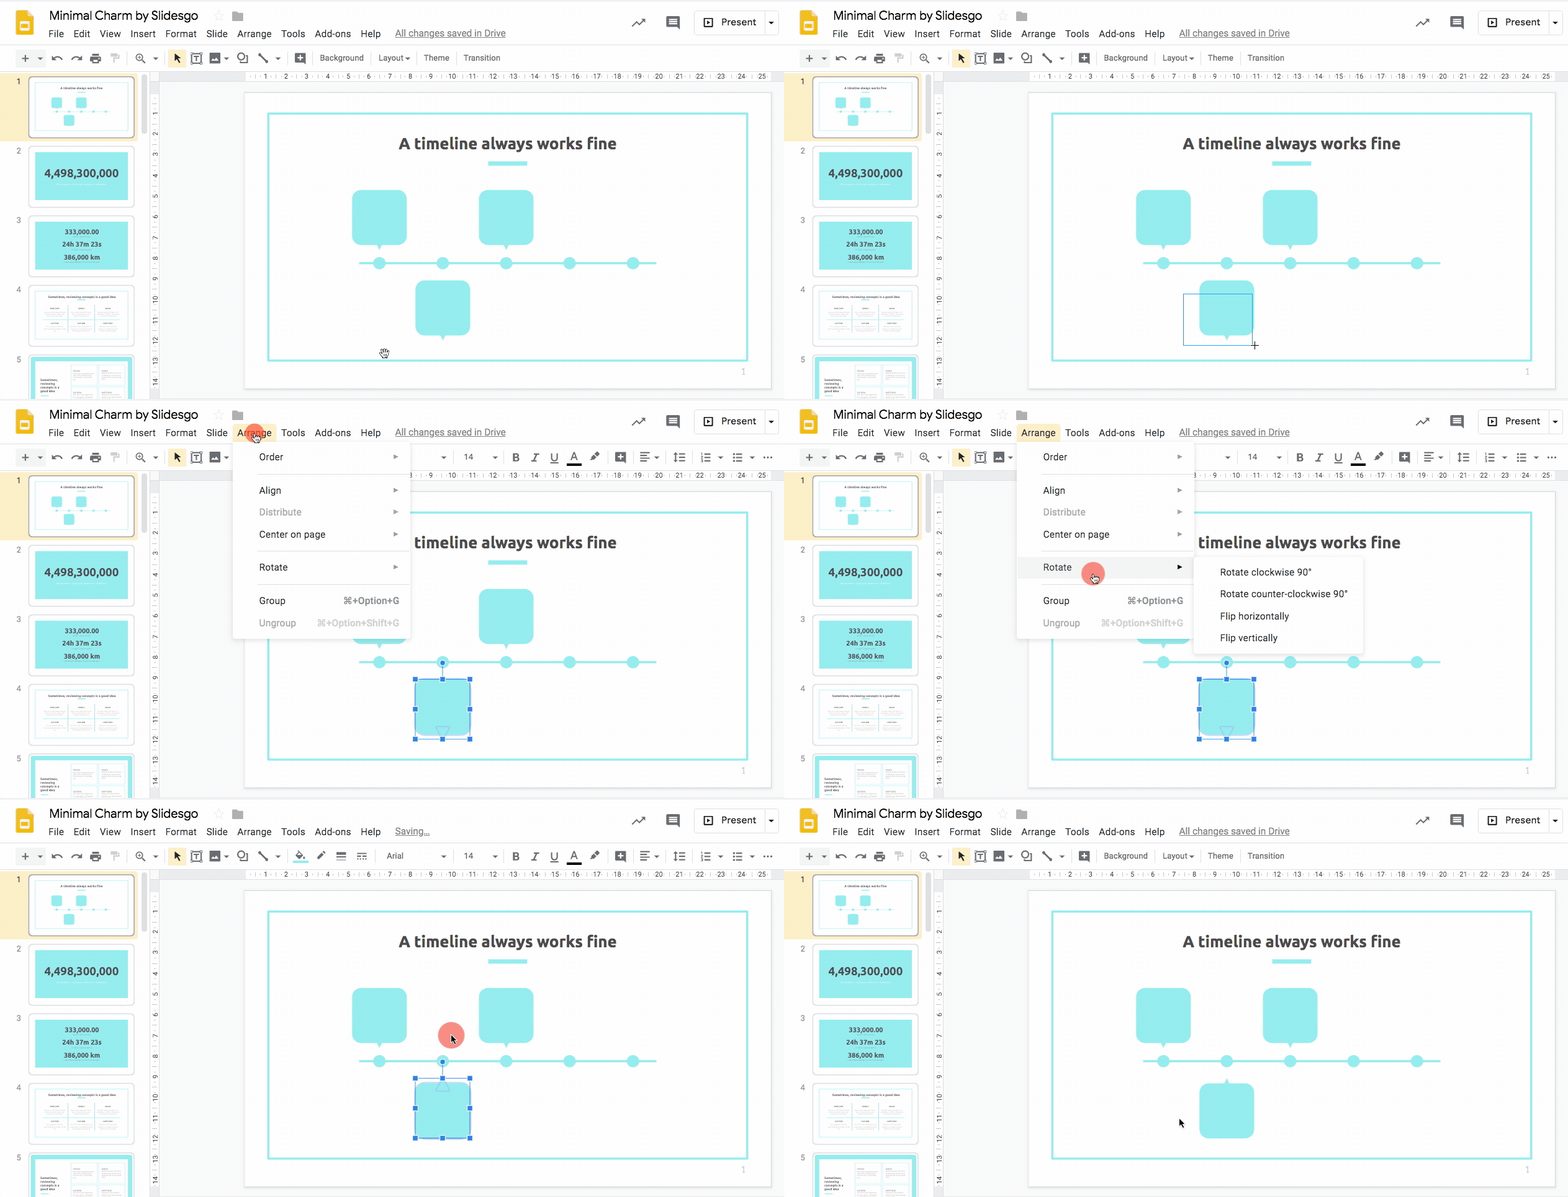
- Copy and paste the callouts and place them above and below the line alternatingly to fill the timeline.
- Adjust as needed to ensure all callouts are properly aligned and are all of the equal distance from their corresponding circles.
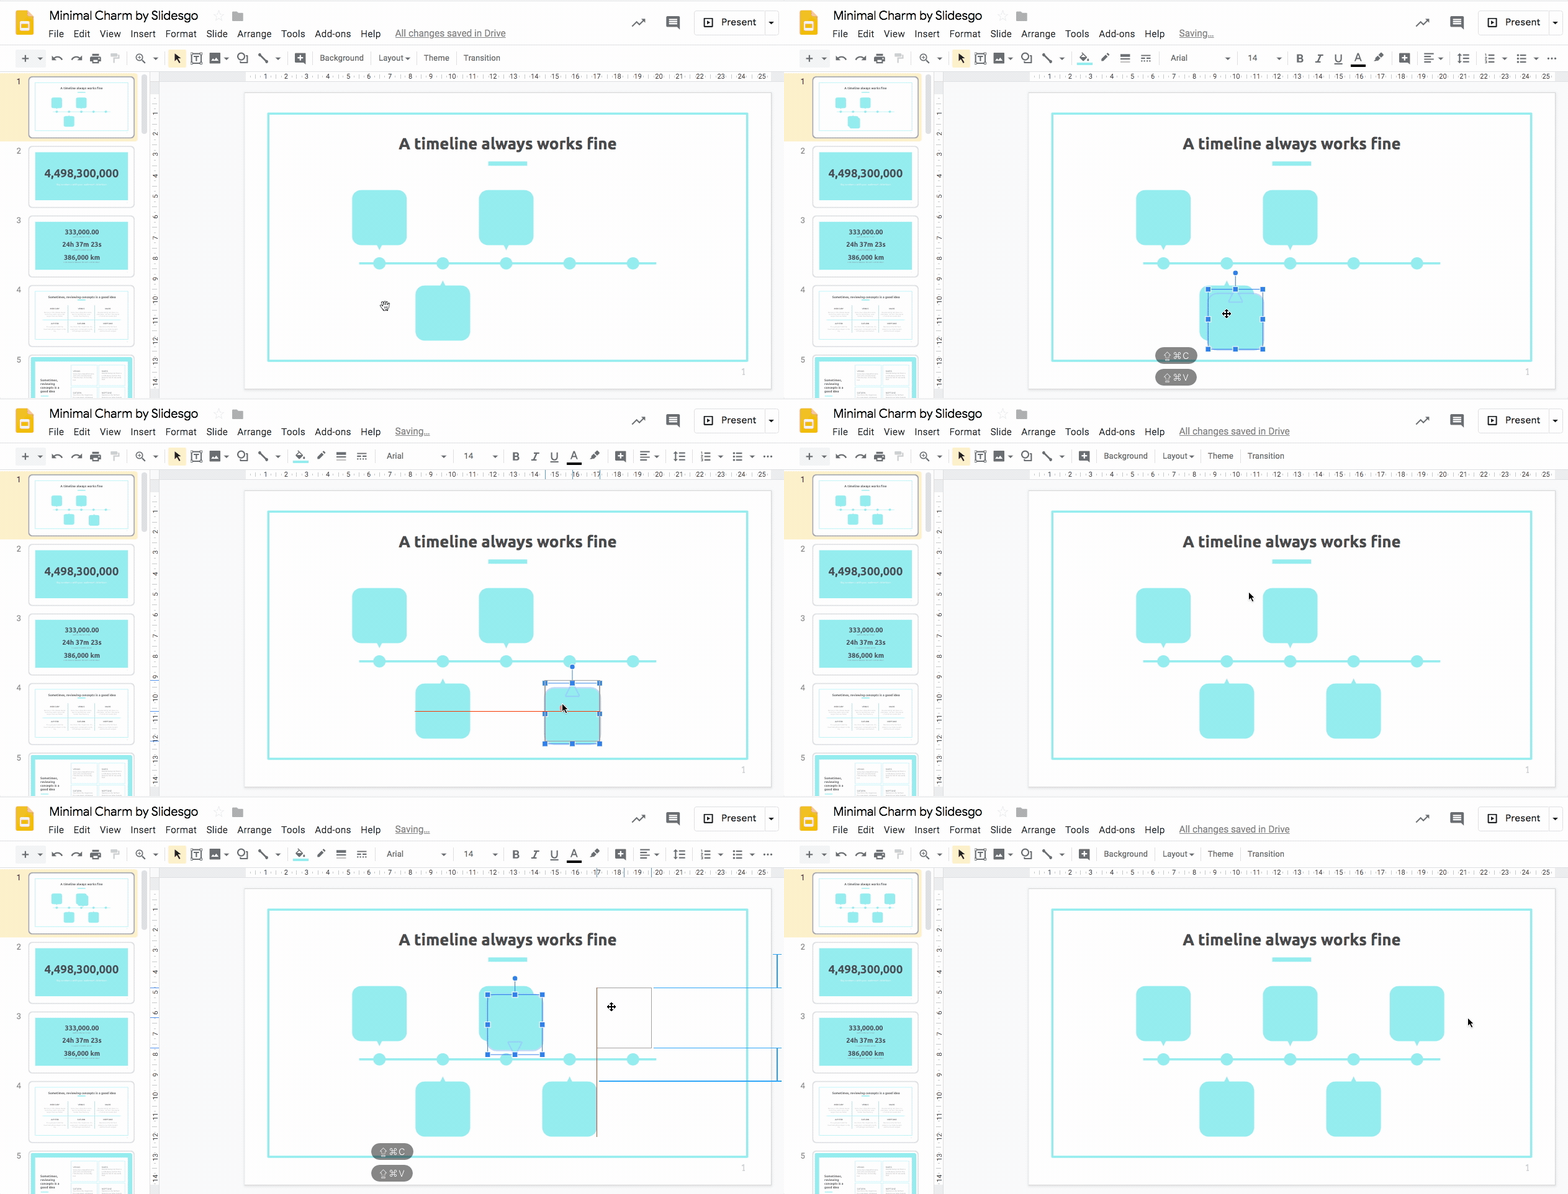
Creating text boxes
- In the toolbar, select Text box. This is the final step of our tutorial on creating a timeline in Google Slides.
- Click and drag out the area you want the text to be in. Type your title in this text box. We’ll use a title and a description in each text box to provide a short explanation of the milestone.
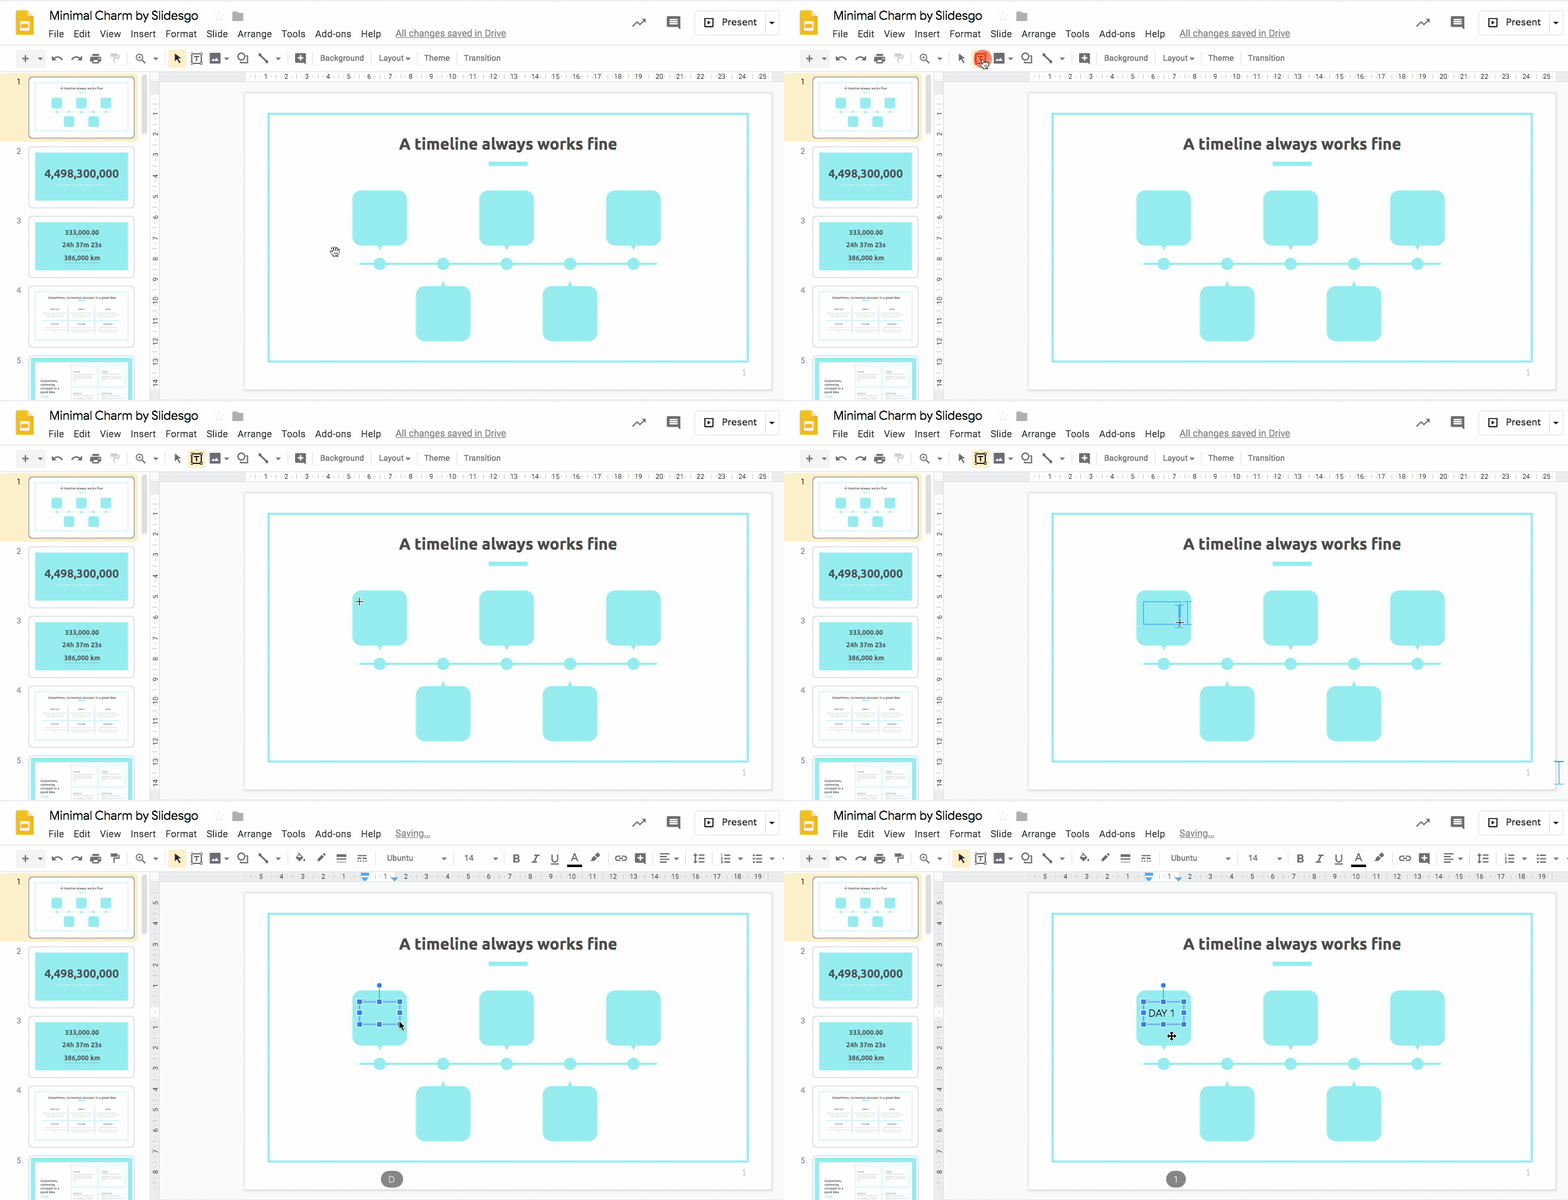
- Resize and style your text as needed with the different text options in the toolbar: Font, Font size, Bold, Italic, Underline, Text color. Remember to maintain the master slides’ design and select the same typeface used in the rest of the presentation.
- In this example, we’ll reduce the font size a little, bold the text, and centralize it.
Pro tip: To centrally align your text within the callout, create a text box that is of the same width as the callout.
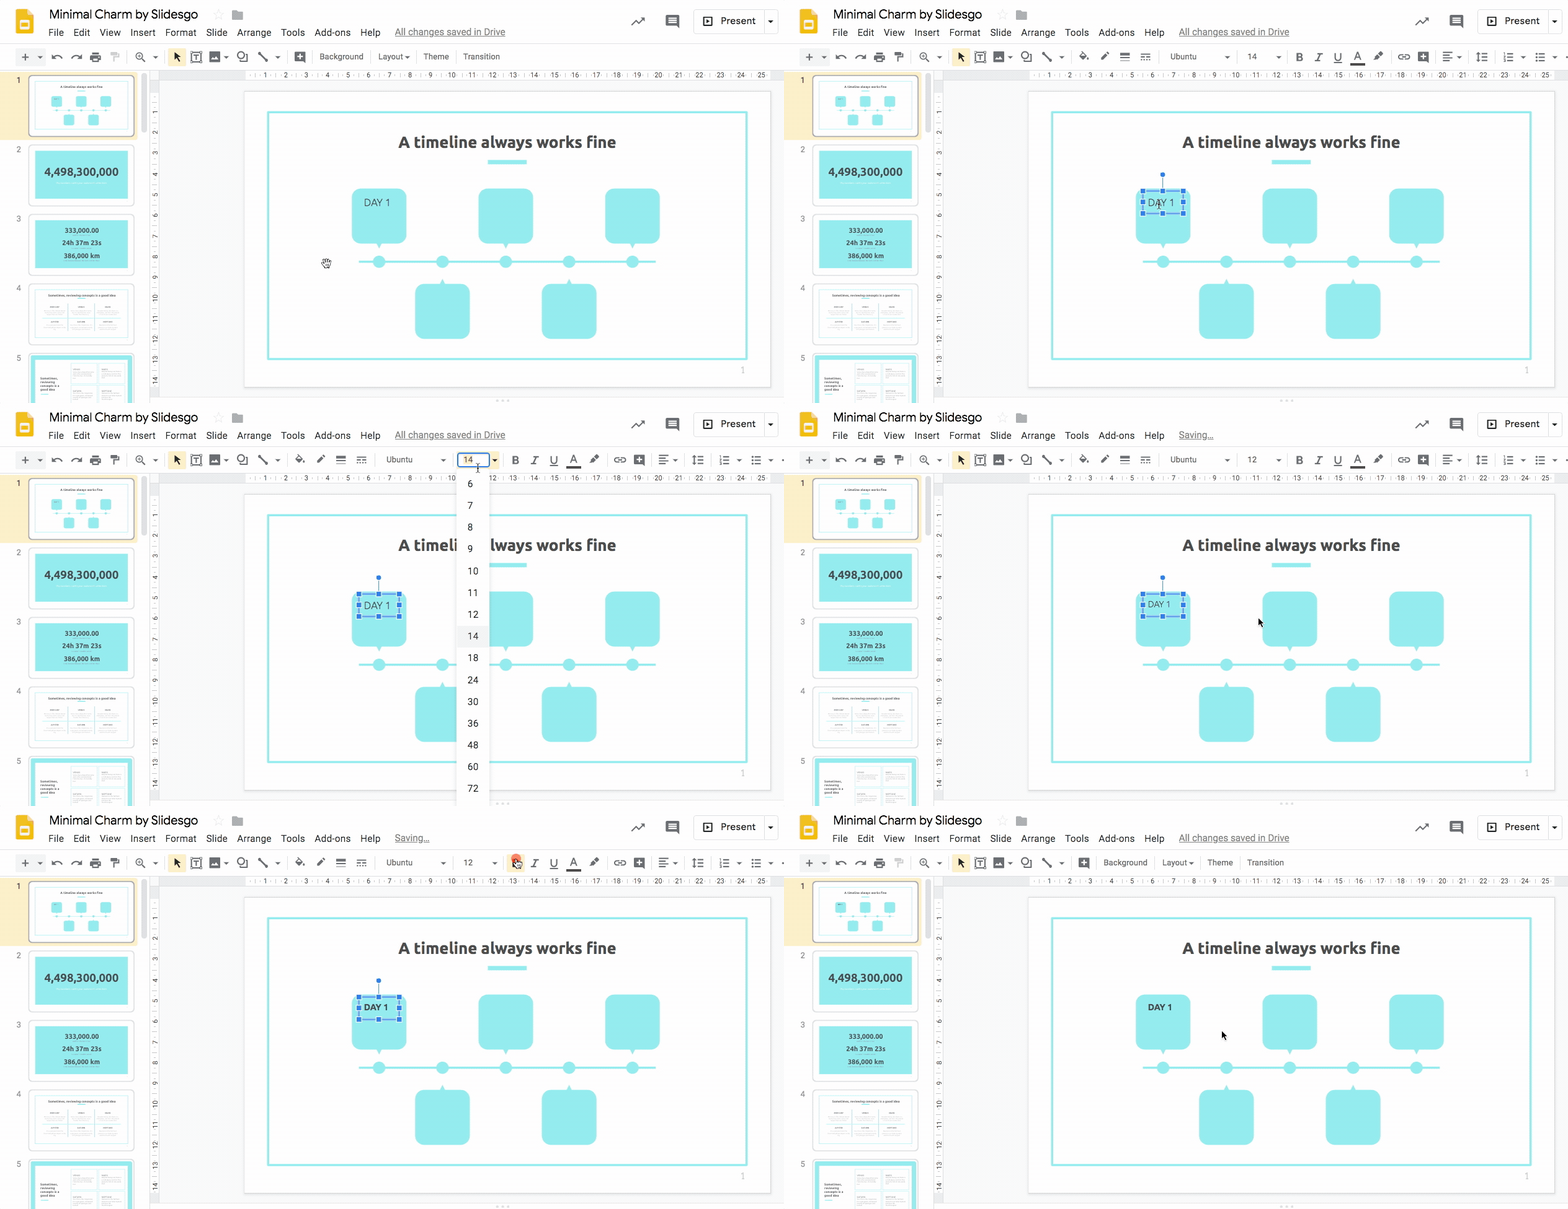
- Copy and paste the text box into all the callouts and adapt the text as needed.

- Click on the center of the callout to start typing. Shapes in Google Slides also double up as text boxes.
- Write a brief description. (Remember, too much text is a presentation’s worst enemy!)
- Format your text as desired. This is to provide more information about each milestone.
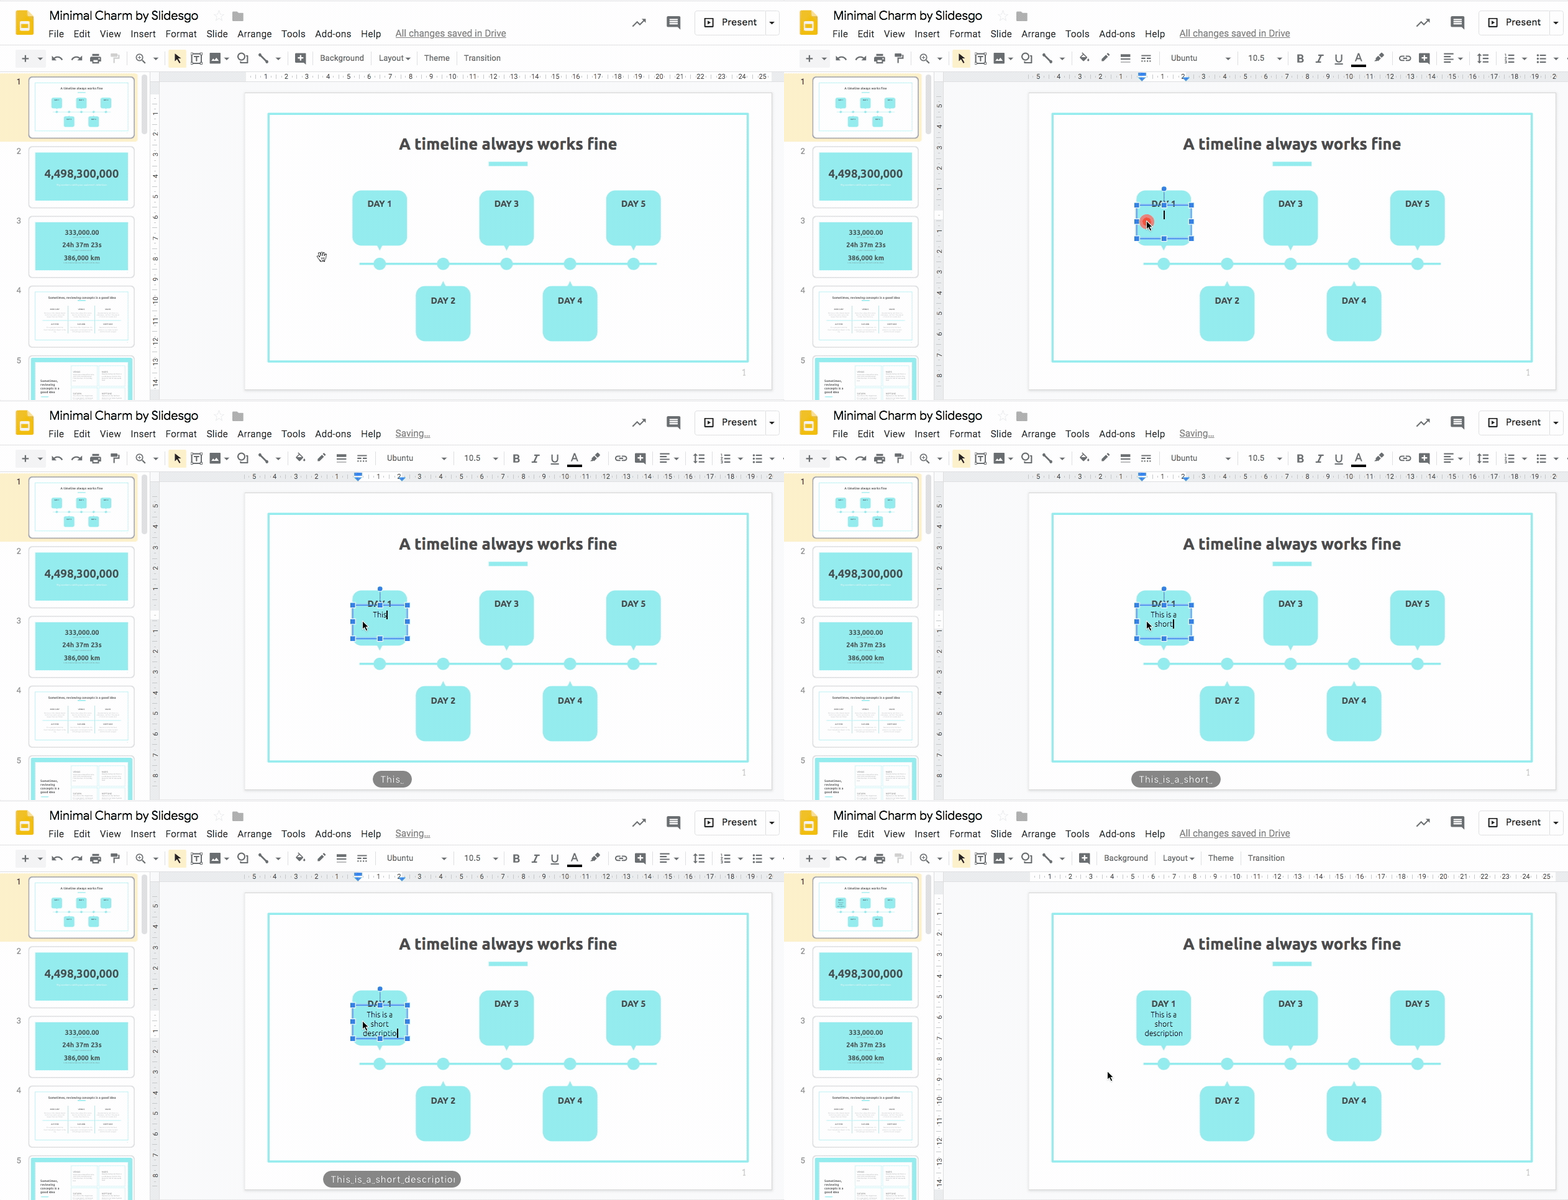
- Fill in the other four descriptions and you’re done.
Well done, you now know how to create a timeline in Google Slides from scratch!
If you’re looking for creative timelines or need project timeline ideas for your next presentation, check out our entire range of templates for Google Slides.
Do you find this article useful?
Related tutorials

How to present survey results in PowerPoint or Google Slides
A survey is a technique that is applied by conducting a questionnaire to a significant sample of a group of people. When we carry out the survey, we start from a hypothesis and it is this survey activity that will allow us to confirm the hypothesis or to see where the problem and solution of what we are investigating lies.We know: fieldwork is hard work. Many hours collecting data, analyzing and organizing it until we have our survey results.Well, we don't want to discourage you (at Slidesgo we stand for positivism) but this is only 50% of the survey work....

How to Create a Venn Diagram in Google Slides
If you wish to give an awesome presentation, using diagrams is great because they make your data look nicer and help your audience understand your points.In this Slidesgo School article, we’ll teach you how to create Venn diagrams in Google Slides so you can have them in your bag of resources!

How to Create a Venn Diagram in PowerPoint
How many times did you have to explain your data with a PowerPoint presentation and you weren’t able to find the most visual way to do it? To help you with this matter easily and quickly, in this Slidesgo School post we will explain how to insert or create a Venn diagram in PowerPoint, as well as its history and components.

How to add and edit maps in Google Slides
Map infographics are very useful for any presentation, as they allow you to transmit data quickly and easily. In this post we are going to explain how to include and edit maps in your Google Slides presentations.
